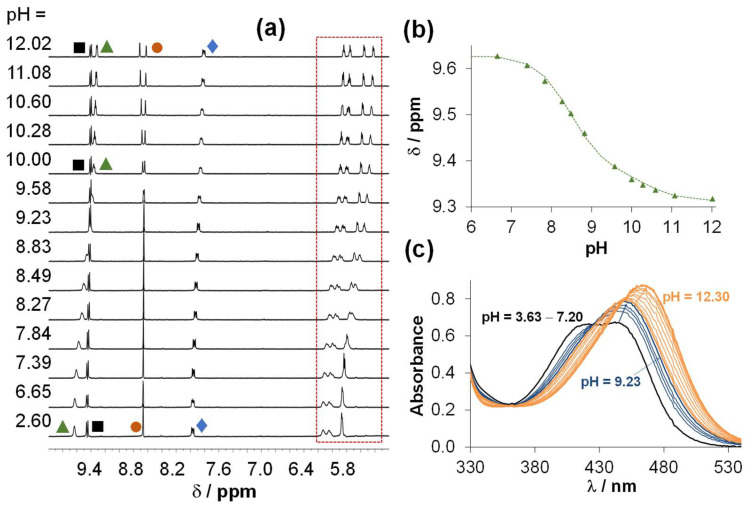
Figure 8.
(a) Downfield region of the 1H NMR spectra recorded for the RuCym complex of HQNO2-L-Pro in the pH range 2–12 in 10% (v/v) D2O/H2O and (b) the chemical shift of CH(2) protons plotted against the pH. Peak assignation is shown in Figure S9 and the framed peaks belong to the p-cymene aromatic CH protons. (c) UV-vis spectra of the same complex at different pH values. {ccomplex = 500 μM (1H NMR) and 50 μM (UV-vis); I = 0.20 M KNO3; l = 1 cm (UV-vis); t = 25.0 °C}.

