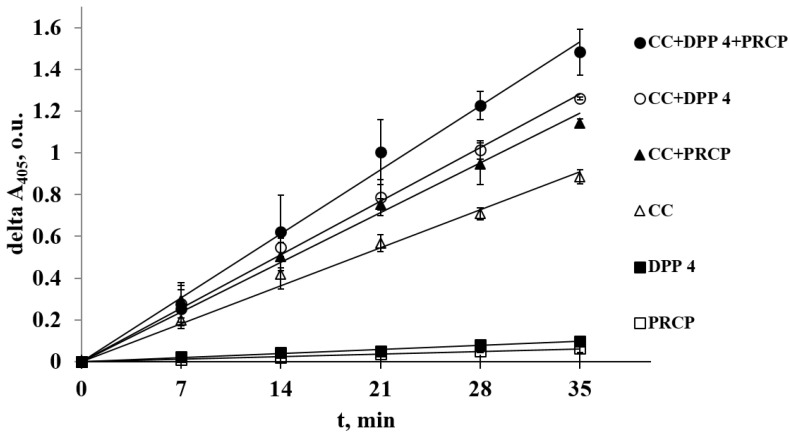
Figure 3.
Proteolysis of gliadins by six samples of T. molitor digestive peptidase preparations: 1. PRCP (white squares), 2. DPP 4 (black squares), 3. CC (white triangles), 4. CC + PRCP mixture (black triangles), 5. CC + DPP 4 mixture (white circles), and 6. CC + DPP 4 + PRCP mixture (black circles) (description of the curves from bottom to top). Proteolysis of gliadins was detected by an increase in free amino groups using 2,4,6-trinitrobenzene sulfonic acid (TNBS). The error bars represent standard deviation.

