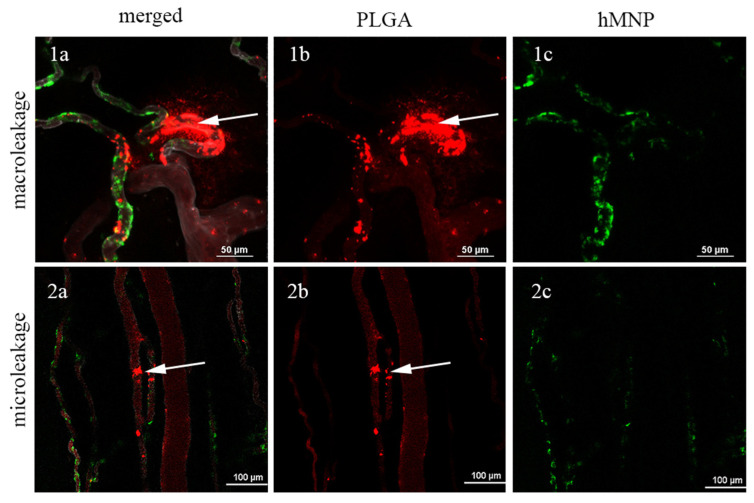
Figure 9.
Investigation of nanoparticle extravasation in tumor and peritumoral area in 4T1 tumor-bearing mice. Representative images of macroleakages (1) and microleakages (2): (1a,2a) merged images; (1b,2b) PLGA-Cy5 NP (red channel); (1c,2c) hMNP-FITC (green channel). Leakage areas are indicated by white arrows. Scale bar—50 μm (1) and 100 μm (2).

