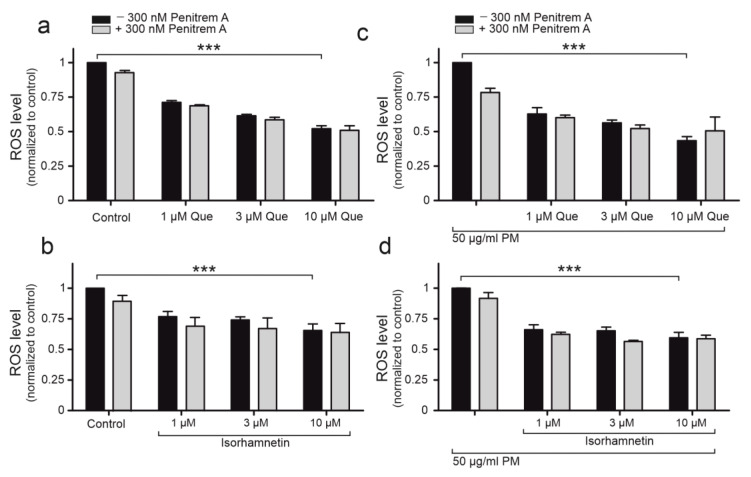
Figure 5.
The influence of quercetin and isorhamnetin on intracellular ROS level. Black bars represent the effect of quercetin (1, 3, 10 µM) (a) and isorhamnetin (1, 3, 10 µM) (b) on intracellular ROS level. Influence of 50 µg/mL PM on ROS intracellular level along with quercetin (1, 3, 10 µM) (c), isorhamnetin (1, 3, 10 µM) with 50 µg/mL PM (d). Gray bars represent the data after application of 300 nM penitrem A. Data is normalized to the control values and expressed as means ± SD, n = 3. Statistical significance was determined at p < 0.001 (***) by one-way ANOVA.

