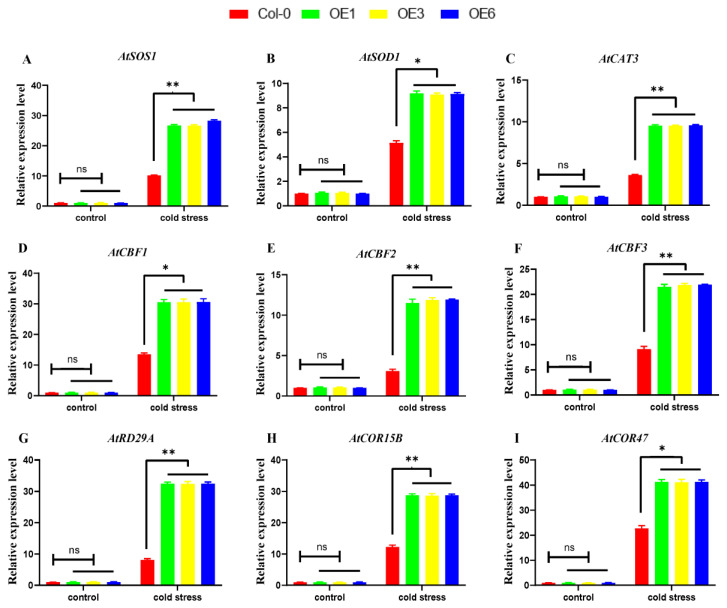
Figure 9.
Analysis of ROS-related marker genes and cold-response-related genes in transgenic plants. (A–C) ROS-related marker genes expression analysis. (D–I) Cold-response-related genes expression analysis. Control: before the low-temperature stress at 4 ℃, cold stress: low-temperature stress at 4 ℃ for 24 h. The expression level was normalized to that of AtACTIN1. Data were expressed as the mean of triplicate values, and the error represented the SD. Asterisks indicate statistically significant differences: Non- significant (ns), p < 0.05 (*) and p < 0.01 (**).

