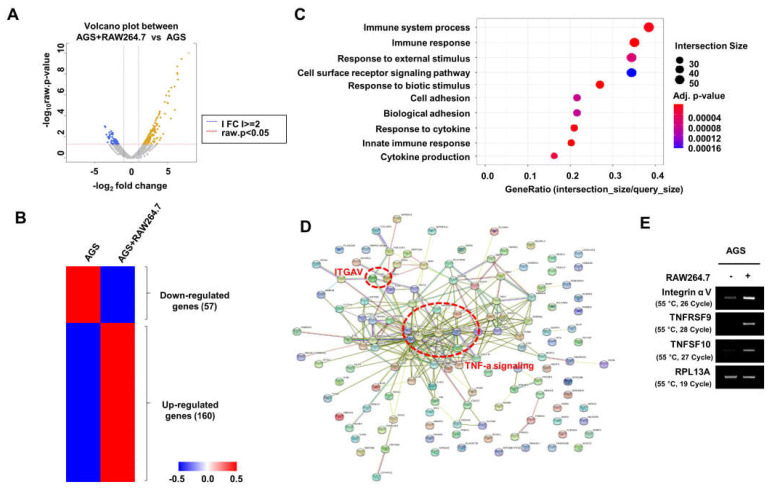
Figure 1.
RNA−Seq analysis in AGS cells cocultured with RAW264.7 cells. (A,B) Volcano plot (A) and heat map (B) in human gastric cancer cells, AGS cells, and AGS cells cocultured with mouse macrophage RAW264.7 cells. (C) Gene ontology enrichment analysis. (D) STRING analysis. (E) The expression of integrin αV, TNFRSF9, and TNFSF10 was analyzed by RT−PCR (three replicates).

