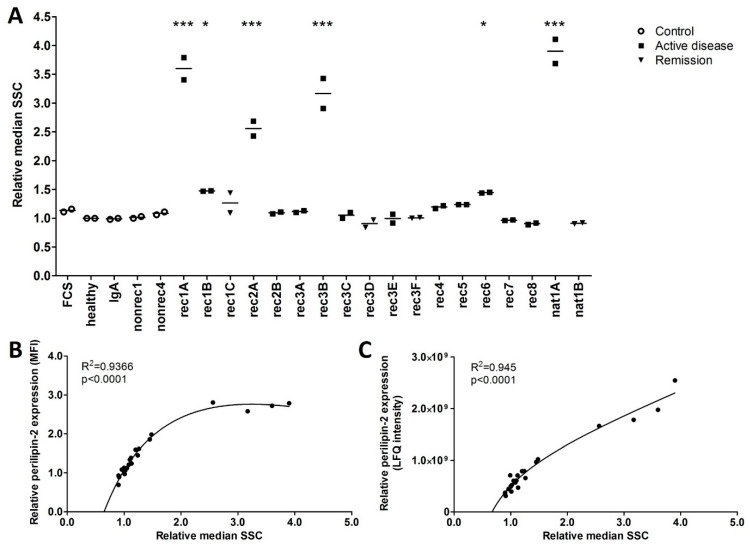
Figure 4.
FSGS plasma-induced perilipin-2 expression is correlated with granularity in hPod. (A) Granularity as measured by flow cytometry side scatter (SSC). Median SSC of two replicate experiments and their means relative to healthy plasma are depicted. Circles represent controls, squares active disease FSGS plasmas, and triangles (partial) remission plasmas. * p < 0.05, *** p < 0.001 compared to healthy plasma. (B) Correlations of median perilipin-2 fluorescence intensities (MFI) from Figure 2B with the relative median side scatter (SSC) from (A). Non-linear fit equation: Y = 12.13 × X/(0.9694 + X) − 0.6616 × X − 4.429. (C) Correlations of median perilipin-2 LFQ intensities from Figure 2A with the relative median side scatter (SSC) from (A). Non-linear fit equation: Y = 8.043 × 10¹⁰ × X/(0.0093 + X) + 4.319 × 10⁸ × X − 7.963 × 10¹⁰. FCS: fetal calf serum; healthy: pooled plasma from five healthy donors; IgA: patient with IgA nephropathy; nat: patient with FSGS in the native kidneys; nonrec: patient with non-recurrent FSGS; rec: patient with recurrent FSGS.

