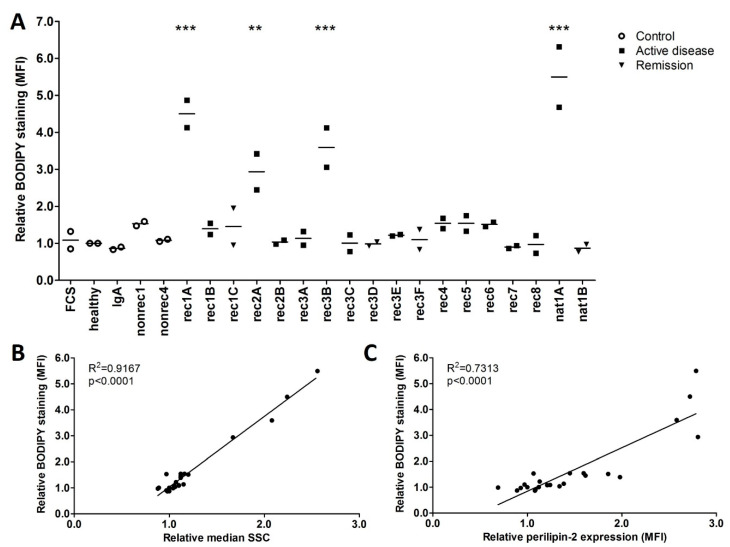
Figure 6.
FSGS plasmas that increased BODIPY staining also increased granularity and perilipin-2 expression in hPod. (A) hPod differentiated in 6-well plates (Corning) were exposed in duplicate to active disease and remission FSGS plasmas, and to (disease) control plasmas. Prior to harvesting, cells were incubated with neutral lipid dye BODIPY 493/503 and flow cytometry was used to measure median fluorescence intensity (MFI). MFI of two replicate experiments and their means relative to healthy plasma are depicted. Circles represent controls, squares active disease FSGS plasmas, and triangles (partial) remission plasmas. ** p < 0.01, *** p < 0.001 compared to healthy plasma. (B) Correlation of BODIPY MFI from (A) with the relative median side scatter (SSC) from the same experiment, showing a significant and linear correlation. (C) Correlation of BODIPY MFI from (A) with the median perilipin-2 MFI from Figure 2B. FCS: fetal calf serum; healthy: pooled plasma from five healthy donors; IgA: patient with IgA nephropathy; nat: patient with FSGS in the native kidneys; nonrec: patient with non-recurrent FSGS; rec: patient with recurrent FSGS.

