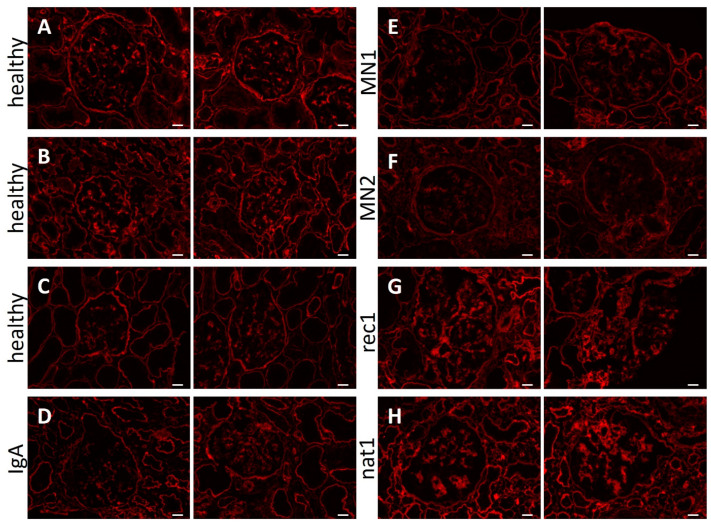
Figure 8.
Increased glomerular perilipin-2 expression in patients with FSGS. Fluorescence microscopy images of kidney cortex sections stained for perilipin-2. Two representative images are presented of healthy subjects (A–C), disease control biopsies from patients with IgA nephropathy (D) and membranous nephropathy (E,F), or biopsies from patients rec1 (G) and nat1 (H) with primary FSGS, presumed to contain CPF(s). Scale bar: 50 µm.

