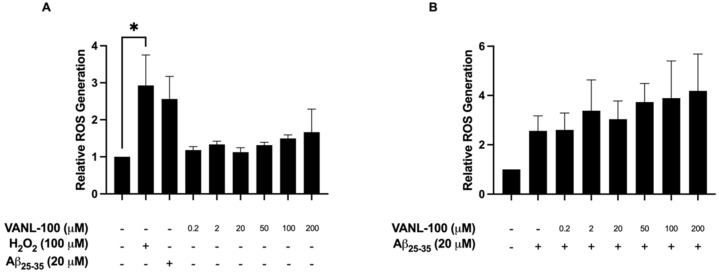
Figure 8.
Effect of VANL-100 treatment on ROS generation in SH-SY5Y cells. Relative ROS generation is shown on the y-axis, and individual treatments are displayed on the x-axis. The bars represent the mean ± SEM of four independent experiments. (A) Effect of H2O2, Aβ25–35, and VANL-100 alone on ROS production. (B) Effect of Aβ25–35 alone and VANL-100 with Aβ25–35 on ROS production. Statistical significance was assessed using one-way ANOVA. * p < 0.05.

