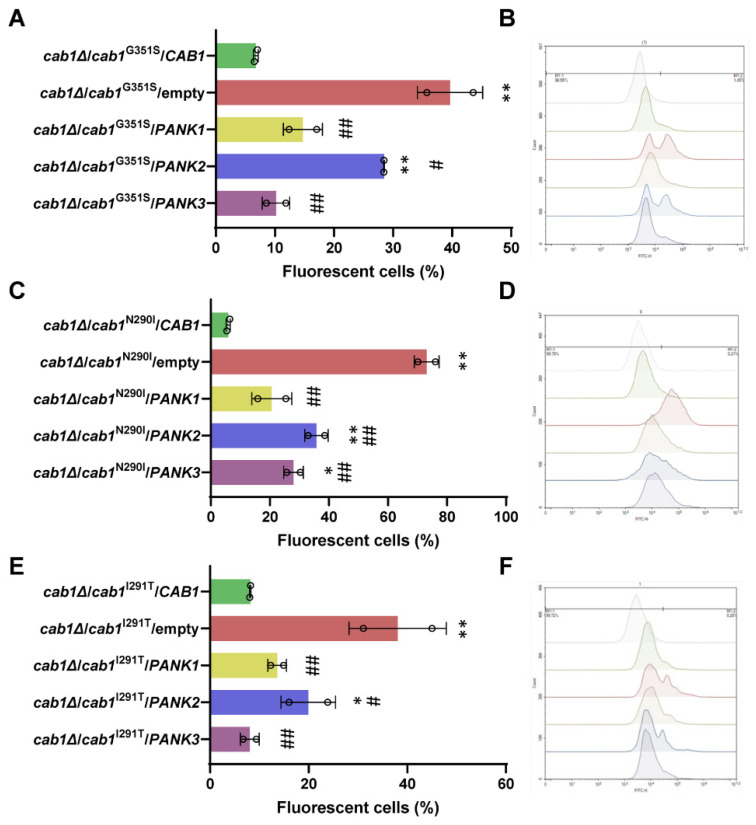
Figure 5.
Analysis of reactive oxygen species (ROS) yeast PanK-deficient mutants expressing human PanK isoforms. ROS measurements were performed for cab1Δ/cab1G351S (A), cab1Δ/cab1N290I (C), and cab1Δ/cab1I291T (E) yeast strains transformed with pFL38/CAB1, EV, and pESC-URA3 vector containing different human PanK isoforms. ROS production was determined as the percentage of fluorescent cells using the DHR123 probe. Cytofluorometry analysis of the cab1Δ/cab1G351S (B), cab1Δ/cab1N290I (D), and cab1Δ/cab1I291T (F) yeast strains transformed with either pFL38/CAB1, empty vector or pESC-URA3 vector containing different human PanK isoforms following staining with DHR123 probe. Each curve represents the distribution of the measured events (counts) according to their fluorescence intensity expressed in a log unit. The grey spectrum represents background autofluorescence. The strains were grown in YP medium supplemented with 2% galactose at 28 °C. This assay was conducted in triplicate (n = 3) and the plotted graphs represent the average ± SEM. *: p < 0.05 and **: p < 0.01 relative to mutant strain transformed with CAB1 allele and #: p < 0.05 and ##: p < 0.01 relative to mutant strain transformed with the empty vector.

