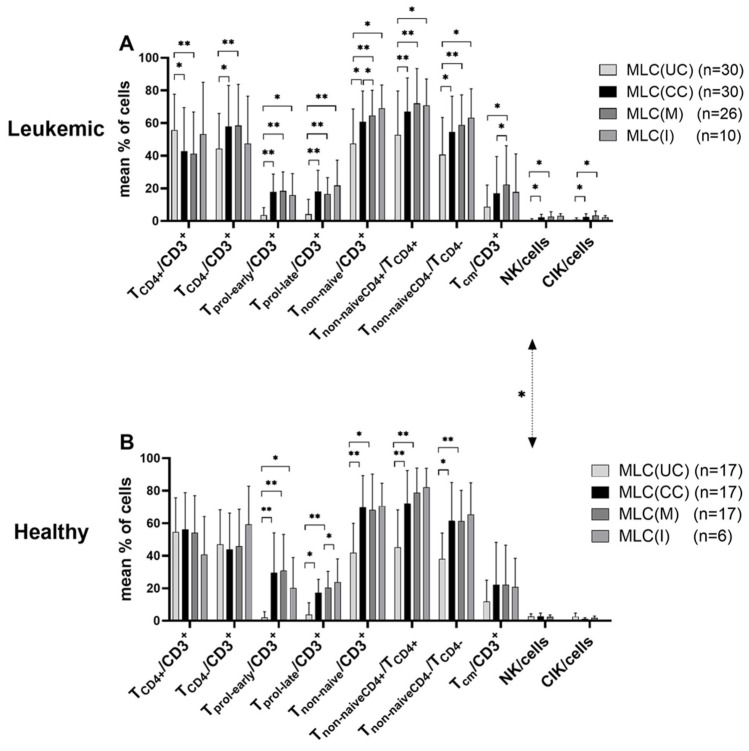
Figure 2.
Composition of immune-reactive cells before and after T-cell-enriched MLC using (A) leukemic and (B) healthy WB with or without Kit pretreatment. Cells were analyzed via flow cytometry before and after 7 days of (T-cell-enriched) MLC with Kit-pretreated or untreated WB and IL-2. Cells before MLC from WB without added Kits as control (MLC(UC)), and cells after MLC, from WB pretreated with Kit-M (MLC(M)), Kit-I (MLC(I)) or without added Kits as control (MLC(CC)), are given. Mean frequencies ± standard deviation of immune-reactive cell subpopulations in (A) leukemic (AML/MDS) and (B) healthy samples are given; n—number of cases. Differences were considered as significant (*) when p ≤ 0.05 and as highly significant (**) when p ≤ 0.005. Double-sided arrows give (significant) differences between defined healthy and leukemic immune-reactive cell subtypes. Abbreviations of cell subpopulations are given in Table 1.

