Figure 5.
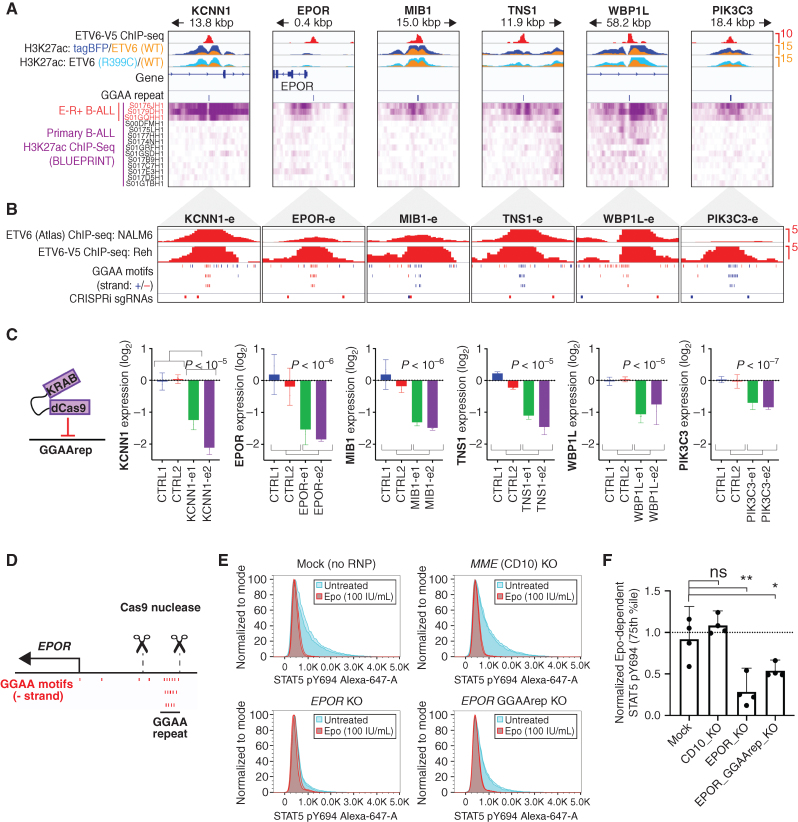
GGAA microsatellite enhancers are direct regulators of ETV6–RUNX1 signature gene expression. A, ChIP-seq data from transgene-expressing Reh cells (top) and primary B-ALL samples (bottom) for selected E-R signature gene-linked, ETV6-regulated enhancers. ETV6-WT-V5 ChIP-seq is from doxycycline-induced, transgene-expressing Reh cells. H3K27ac ChIP-seq data were generated from tagBFP, ETV6-WT-V5, and ETV6-R399C-V5 cells, and overlays are color-coded as indicated. Also shown are positions of GGAA repeats called genome-wide in hg38 (3× GGAA). Primary B-ALL H3K27ac ChIP-seq data (Blueprint) is shown at the bottom, with E-R+ B-ALL samples indicated in red. B, Detail (1,000 bp window) of GGAA repeat enhancers shown in A, showing ETV6 ChIP-seq peaks, position of individual GGAA motifs (blue = positive strand, red = negative strand), and position of sgRNA target sequences used in C. C, Relative transcript levels for genes associated with enhancers shown in A–B 72 hours after doxycycline induction of Reh cells expressing doxycycline-inducible dCas9-KRAB and transduced with control sgRNAs or sgRNAs targeting the indicated GGAA microsatellite enhancer. Gene expression is normalized to the average of the two control sgRNAs (error bars = 95% CI of PCR replicates). Significance was calculated as t test of combined replicates for both control sgRNAs versus both enhancer-targeting sgRNAs. D, Genomic position of EPOR TSS, GGAA repeat, and sgRNAs used for GGAA repeat deletion in E–F. E, Representative phospho-STAT5 signal in AT-2 cells electroporated with Cas9-sgRNA complexes targeting the genes MME (CD10-KO) or EPOR (EPOR-KO), flanking the EPOR-adjacent GGAA repeat (EPOR GGAA del), or mock-electroporated (no sgRNA or Cas9). Samples were divided and treated with 100 U/mL Epo (red) or untreated (blue). All samples from one of two independent experiments are shown (two replicates per condition). F, Difference in phospho-STAT5 signal (75th percentile) for Cas9-RNP modified AT-2 cells. Results from two separately conducted experiments with two biological replicates each were normalized to within-experiment control samples and pooled for analysis (two-tailed t test). *, P < 0.05; **, P < 0.01; ns, not significant; P > 0.05.

