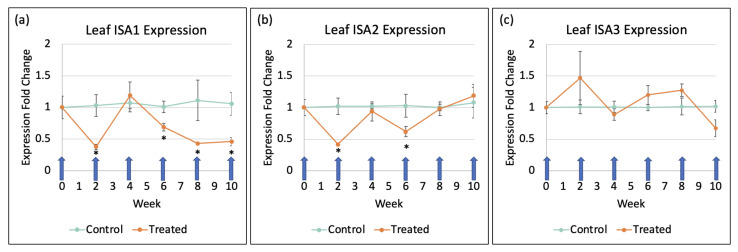
Figure 1.
ISA gene expression in leaves over the course of the growth cycle. Application of foliar dsRNA-lmPEI is denoted by the blue arrows. Samples for PCR were collected prior to the application of the particles. Significantly different (p ≤ 0.05) expression levels between treatment groups are denoted with ‘*’ (n = 15 plants, in triplicate, each for treatment and control). (a) ISA1, (b) ISA2, (c) ISA3.

