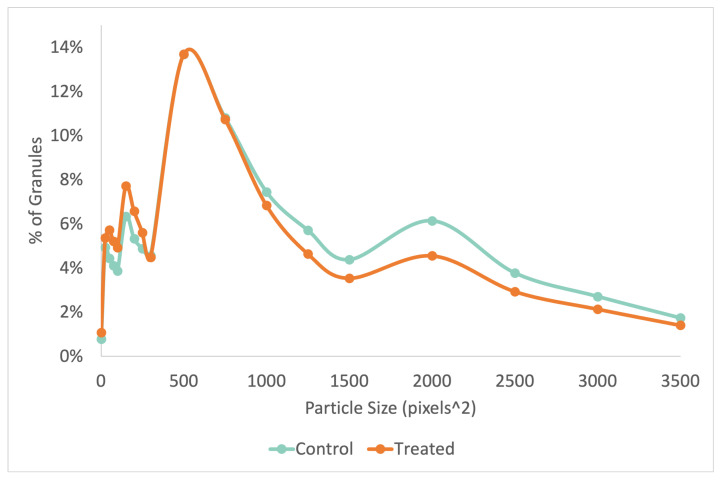
Figure A3.
A non-cumulative distribution plot of the starch granule sizes, in pixels, as determined by ImageJ [18]. Note the increased proportion of granules smaller than 500 pixels and decreased proportion of granules larger than 1000 pixels in the treated group (n = 15,000 for control and n = 14,000 for treated).

