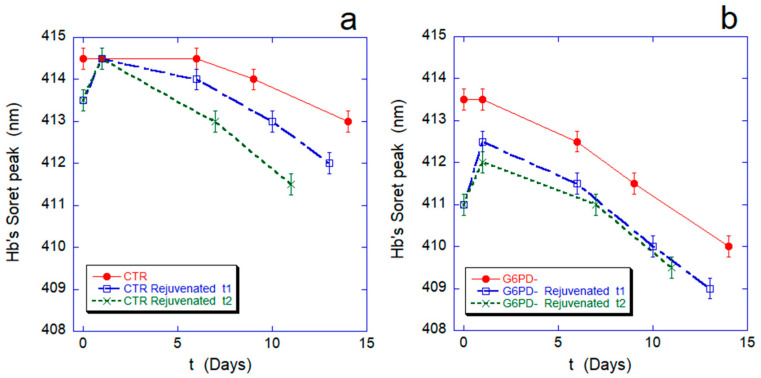
Figure 1.
Hb oxidation rate along the RBCs aging for normal cells (panel (a)) and G6PD-defective erythrocytes (panel (b)). In each panel, the red curve is the oxidation curve on the native sample, while the blue and green lines refer to rejuvenation performed after 6 (rejuvenated t1) or 12 days (rejuvenated t2). The Hb oxidation curves after revitalization are artificially shifted to zero (relative time) for ease of comparison. All data points are reported with their standard deviation (SD).

