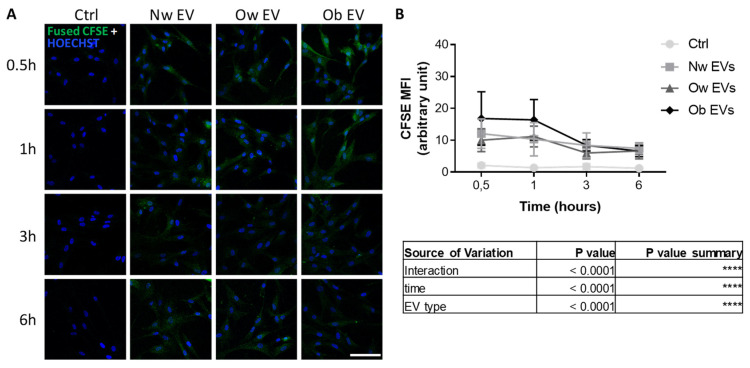
Figure 2.
(A) Confocal microscopy analysis of MSC treated for 0.5, 1, 3 and 6 h with CFSE+ EVs from participants with normal weight (Nw), overweight (Ow) and obesity. Pictures show the resultant recipient cells as proof of EV uptake. Nuclei were stained with Hoechst (blue). Scale bar: 100 μm. (B) Mean fluorescence intensity (MFI) quantification of CFSE + MSCs following the treatment with CFSE+ EVs. The table below shows the results from ANOVA 2-way analysis.

