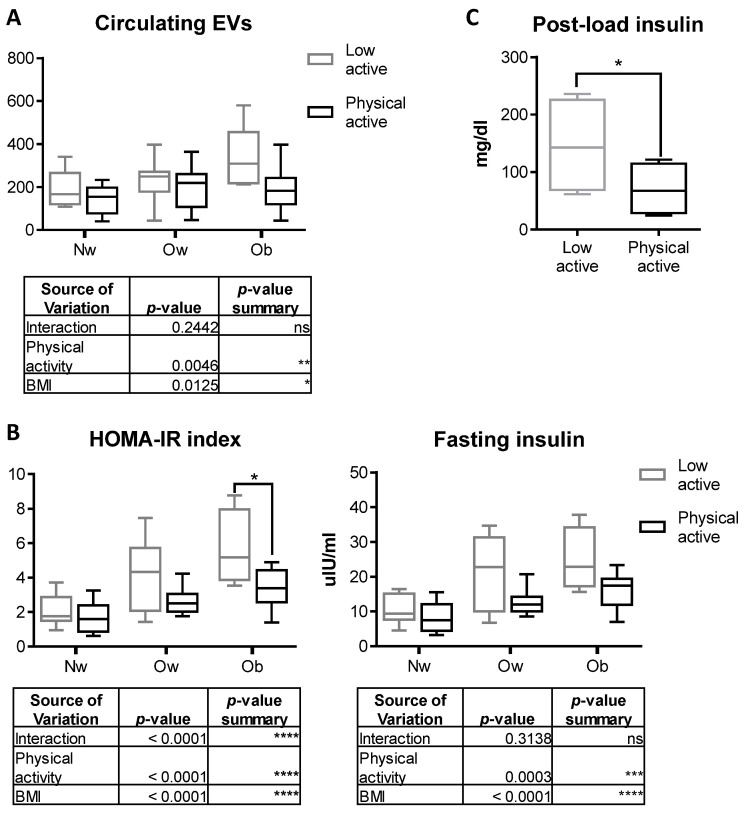
Figure 6.
(A) Quantification of circulating EVs by FACS in participants with normal-weight, overweight and obesity in relation to sport activities. The table below shows the results from ANOVA 2-way analysis. (B) Evaluation of basal HOMA-IR Index and fasting plasma insulin in participants with normal weight, overweight and obesity performing sport activities (physically active) in comparison to their counterparts with a sedentary lifestyle (low active). (C) Evaluation of plasma insulin following glucose load assessed in children with obesity performing sport activities (physically active) in comparison to their counterparts with a sedentary lifestyle (low active). Normal weight group: n = 7 low active and n = 18 physically active; overweight group: n = 9 low active and n = 15 physically active; obese group: n = 5 low active and n = 15 physically active. * p < 0.05.

