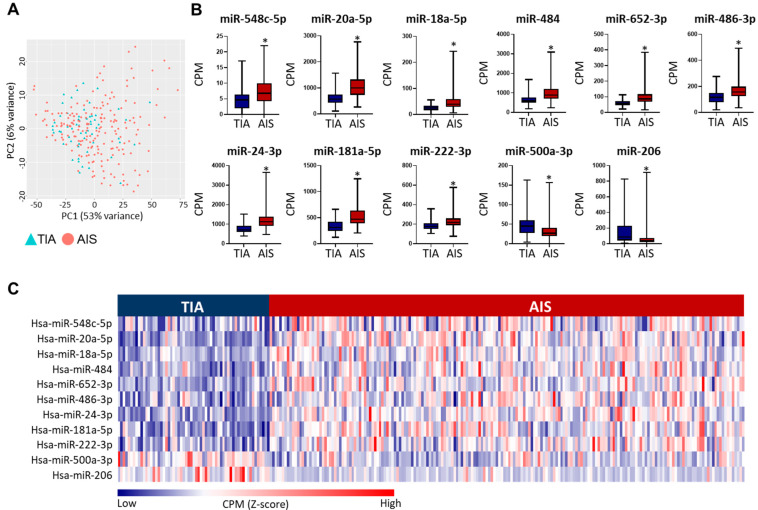
Figure 2.
Circulating miRNA profiles of acute ischemic stroke (AIS) and transient ischemic attack (TIA) patients. (A). PCA plot depicts the variability in miRNA expression between TIA and AIS patients. (B). Box and whiskers plots show the differences in counts per million (CPM) in AIS and TIA patients of the 11 differentially regulated, validated miRNAs. Mean with minimum and maximum values, and upper and lower quartiles are depicted for each data set with significant comparisons annotated by an asterisk (*) on top (p < 0.0001). (C). Heatmap shows the dysregulation in identified miRNA panel (Z-scores calculated CPM) between AIS and TIA patients in the overall study population.

