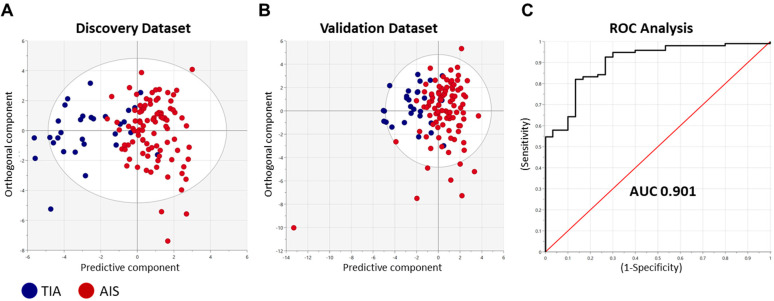
Figure 3.
Discriminative performance of the identified miRNA panel to identify AIS patients. Orthogonal projections to latent structures-discriminant analysis (OPLS-DA) was performed using the top differentially regulated miRNAs (n = 24) in the discovery cohort data. The classifier was trained on data from all participants in (A). discovery cohort (n = 122) and tested on the (B). validation cohort (n = 119). Scatter plots show the predictive component to discriminate AIS cases from TIA cases (blue dots—x-axis) versus the orthogonal component representing a multivariate confounding effect that is independent of stroke (maroon dots—y-axis). (C). ROC curve analysis generated an area under the curve (AUC) of 0.901.

