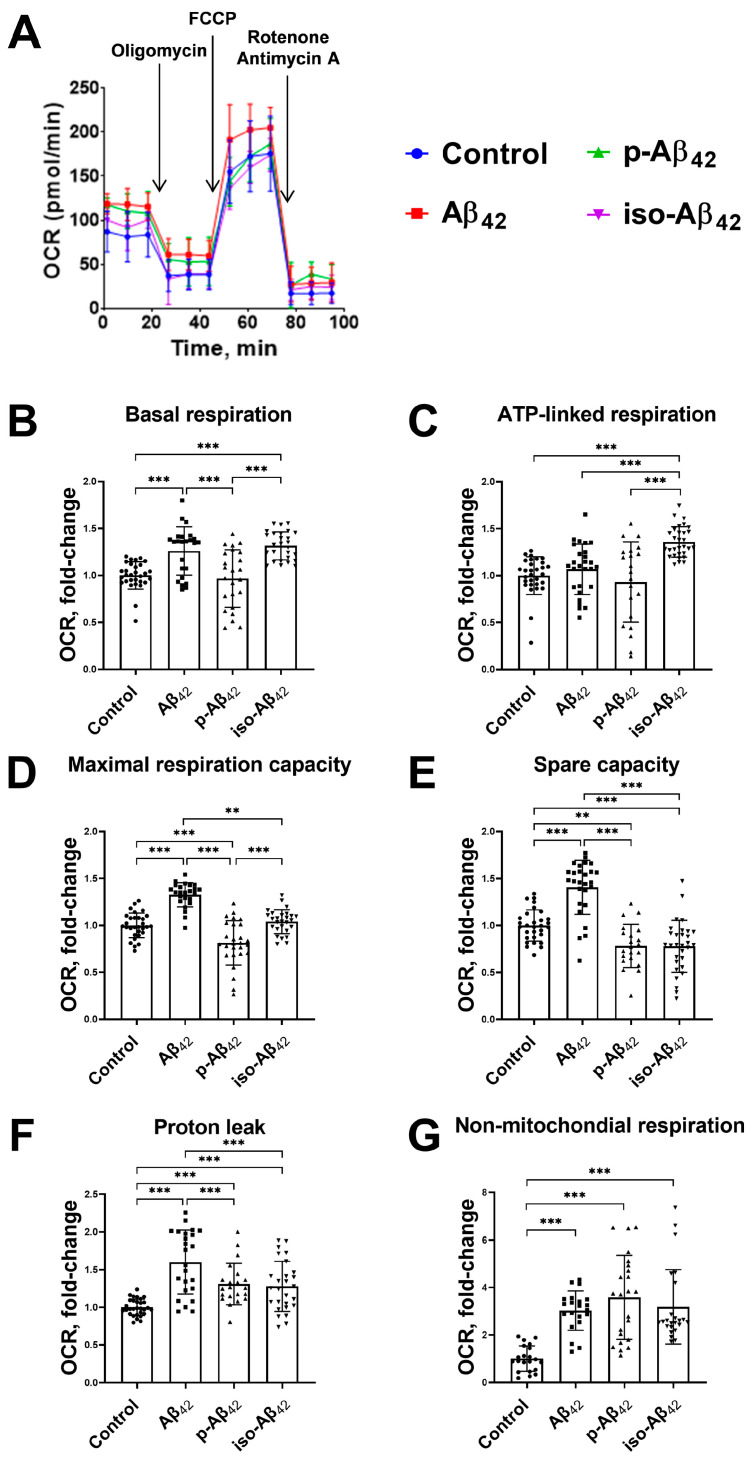
Figure 7.
The effects of beta-amyloid isoforms on the bioenergetic functions in bEnd.3 cells after 24 h incubation. Cells were incubated with 10 µM of Aβ42, p-Aβ42 and iso-Aβ42. (A) Representative raw data of bioenergetic function. (B) Basal respiration, (C) ATP-linked respiration, (D) maximal respiration capacity, (E) spare capacity, (F) proton leak and (G) non-mitochondrial respiration are demonstrated. The results were calculated based on the data obtained from bioenergetic functional analysis (for details, see Figure 5). The values in the control samples were taken as 1. All parameters given are normalized to control. OCR is the oxygen consumption rate. FCCP is carbonyl cyanide 4-(trifluoromethoxy)phenylhydrazone. Each geometric figure (circle/square/up-pointing triangle/down-pointing triangle) in the histogram represents the result in an independent sample and corresponds to the Control, Aβ42, p-Aβ42 and iso-Aβ42. The mean ± SD in 3 independent experiments in 5–8 replications is shown in the figure. The statistical difference between experimental groups was analyzed by one-way analysis of variance using the post hoc Tukey test for multiple comparisons. **—p < 0.01 and ***—p < 0.001.

