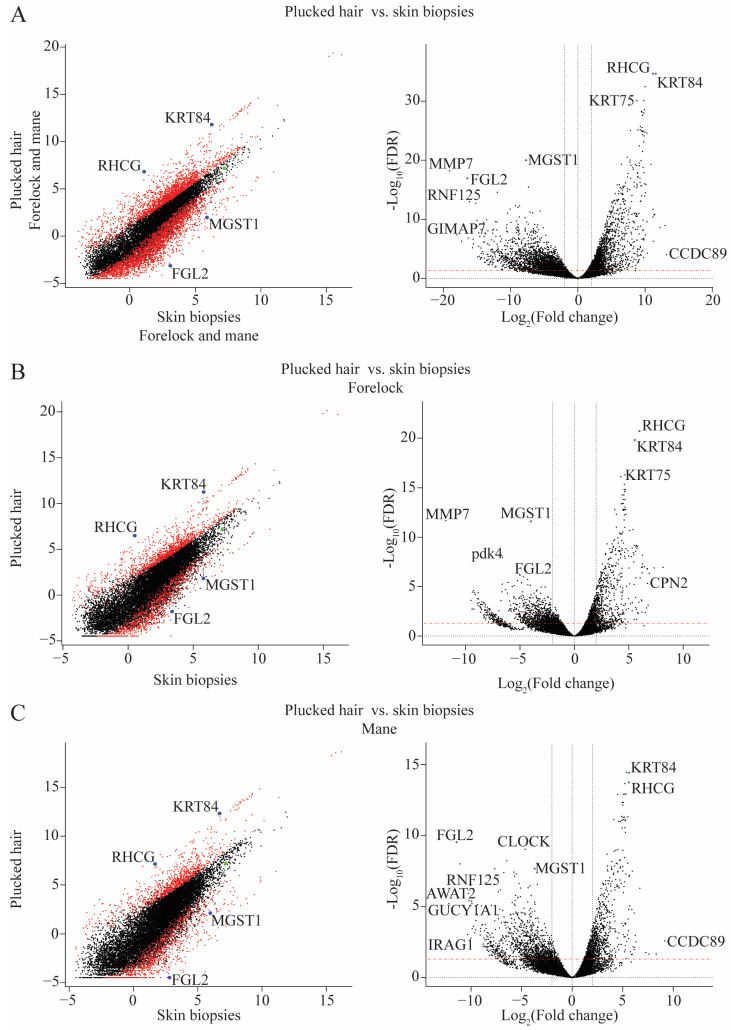
Figure 1.
Scatter plots showing the Log2 average expression (left) and volcano plots visualizing the difference in the transcriptome (right) between plucked hair samples and skin biopsies from the forelock and mane locations combined (n = 7 + 7) (A), from the forelock location only (n = 4 + 4) (B) and from the mane location only (n = 3 + 3) (C). The positive Log2 values in the volcano plots represent genes upregulated in skin biopsy samples, while the negative Log2 values represent genes upregulated in plucked-hair samples.

