Figure 1.
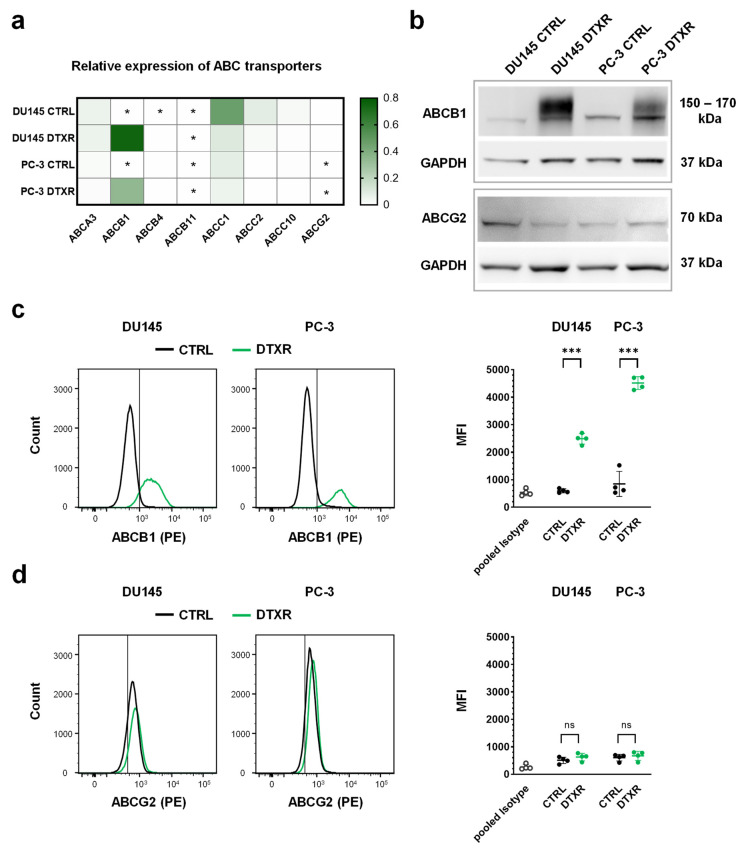
RNA and protein expression of selected ABC transporters, which are known to be involved in taxane resistance and/or MDR, in DU145 and PC-3 DTXR cells compared to CTRL cells. (a) The relative transcript levels of eight selected ABC transporters were plotted on a heat map. Cells with an expression of the respective ABC transporter beyond the detection threshold (CP ≥ 35) are marked with an asterisk (*). (b) Exemplary Western blots for detecting ABCB1 and ABCG2 proteins in CTRL and DTXR cells. GAPDH served as a reference protein. (c,d) Exemplary flow cytometry analysis for (c) ABCB1 and (d) ABCG2 proteins via specific antibodies conjugated with the fluorescent phycoerythrin (PE) in CTRL and DTXR cells. The vertical black lines indicate the threshold of unspecificity according to the pooled isotype controls. The adjacent graphs to the right depict the median fluorescence intensities (MFI) for ABCB1 and ABCG2 protein, respectively. Data are depicted as mean ± standard deviation (SD) of three to four independent biological replicates. Non-paired t-test with Welch’s correction was performed for comparison of CTRL vs. DTXR cells: *** p < 0.001, ns: not significant.

