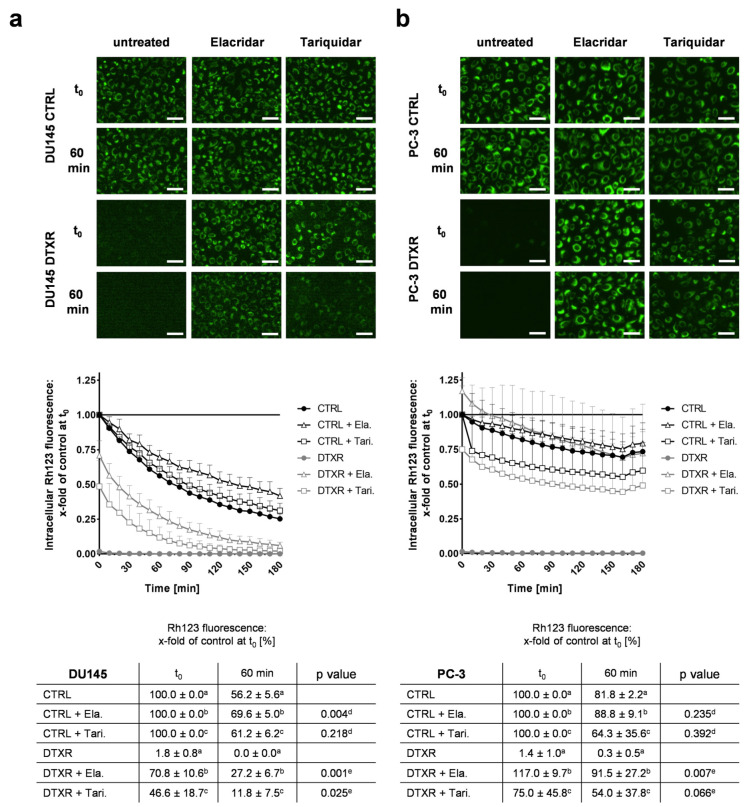
Figure 2.
Influence of ABCB1 inhibitors elacridar and tariquidar on ABCB1 efflux activity of the fluorescent ABCB1 substrate Rh123 in DU145 and PC-3 DTXR cells compared to CTRL cells. (a) DU145 and (b) PC-3 cells were treated with 0.5 µg/mL Rh123 in the presence or absence of an ABCB1 inhibitor (50 nM elacridar or tariquidar) for 15 min. After several washing steps, RPMI 1640 medium with or without one of the inhibitors was added and subsequently the cells were imaged in 10 min intervals. As examples, the first image (t0) and an image taken after 60 min are depicted for CTRL and DTXR cells (scale bar 50 µm). Longitudinal data were normalized to the corresponding treatment of CTRL cells at t0 (indicated by a, b or c in the table; black line in the graph). Data are depicted as the mean of four to five independent biological replicates + SD in the graphs for better readability or ± SD in the tables. Non-paired t-test with Welch’s correction was performed for comparison of d CTRL + elacridar/tariquidar vs. CTRL cells and e DTXR + elacridar/tariquidar vs. DTXR cells at 60 min. Ela.: elacridar, Tari.: tariquidar.

