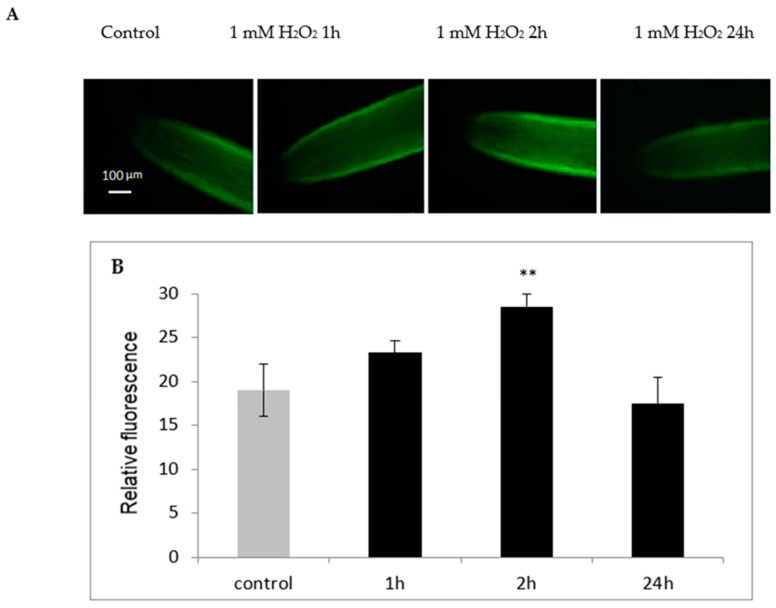
Figure 7.
Bio-imaging of NO level in the roots of cucumber seedlings treated with H2O2 for 1, 2, and 24 h (A) and the mean related fluorescence density ± SD (B). Control plants were not treated with H2O2. NO production was monitored by labeling with the NO-specific fluorescent dye DAF-2D and imaged using fluorescent microscopy. The images are representative for at least three roots for each treatment from four independent replications of the experiment. Asterisks on the figure indicate significant differences (** p < 0.01).

