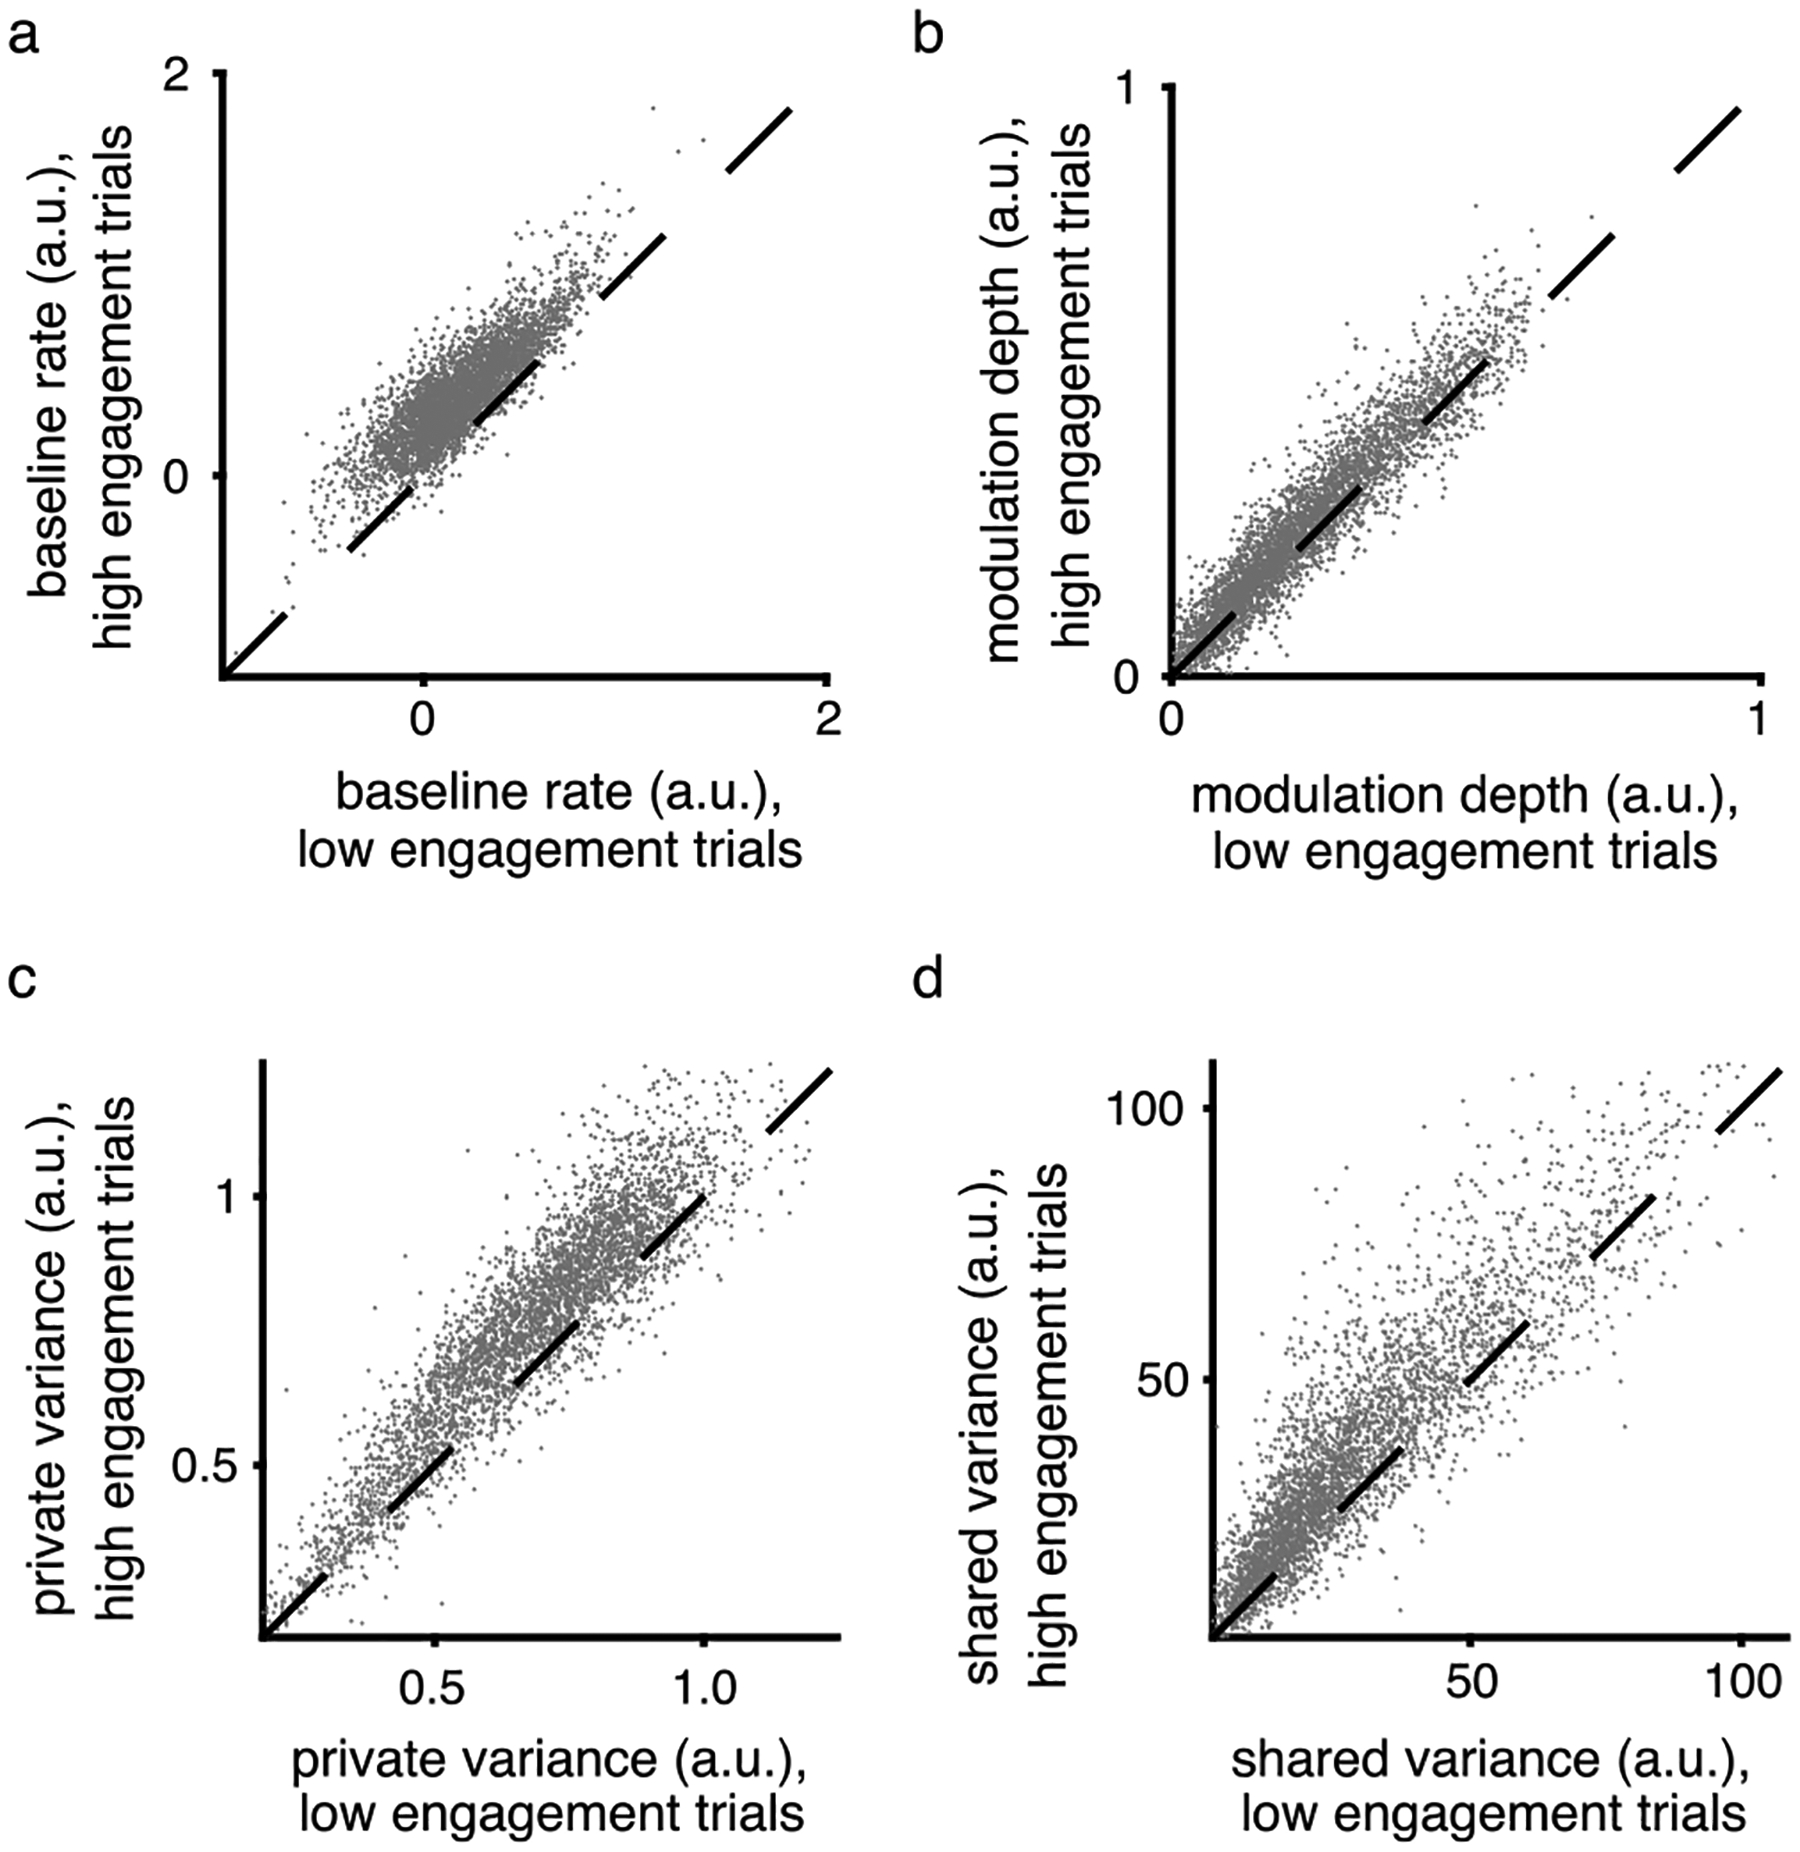
Extended Data Fig. 5 |. Increased neural engagement corresponded with increased baseline firing rate, modulation depth, and spiking variance in single units.

To understand the relationship between neural engagement and the firing properties of individual units, for each experiment we grouped trials during Block 1 based on whether they had above- versus below-average levels of neural engagement (similar to Extended Data Fig. 3). a-b. For each individual unit from all sessions, we fit two cosine tuning models to each unit’s z-scored spike counts: one model was fit to the average spike counts on trials with above-average levels of neural engagement (‘high engagement trials’), while the other model fit to the spike counts on trials with below-average levels of neural engagement (‘low engagement trials’). The cosine model was of the form y = b + m cos(θ − θpref), where y is the unit’s expected firing rate on a trial to target θ, b is the unit’s baseline (average) firing rate, m is the unit’s modulation depth, and θpref is the unit’s preferred direction. We estimated b, m, and θpref using linear regression. Each dot corresponds to one unit. For most units, both the baseline firing rate (b; panel a) and the modulation depth (m; panel b) were higher on high engagement trials than on low engagement trials (in both cases: p < 10−10, paired, two-sided sign test, n = 4074 units). c-d. For each session, we fit a factor analysis (FA) model to the z-scored spike counts of all units during low engagement trials, and then fit a separate FA model to the z-scored spike counts during high engagement trials. Each model had the same form as equation (1), resulting in parameter estimates of L and Ψ. The estimated private variance of unit i is given by Ψii, while the shared variance is given by (LL⊤)ii, where the ii subscript indicates the ith diagonal element. Each dot corresponds to one unit. We found that both the private variance (panel c) and shared variance (panel d) of most units was higher on high engagement trials than on low engagement trials (in both cases: p < 10−10, paired, two-sided sign test, n = 4074 units). This result is expected from Extended Data Fig. 4 because the sum of a unit’s shared and private variances equals its spike count variance. Because a unit’s spike count variance tends to increase with its mean spike count, a higher firing rate will typically correspond with a higher shared and/or private variance.
