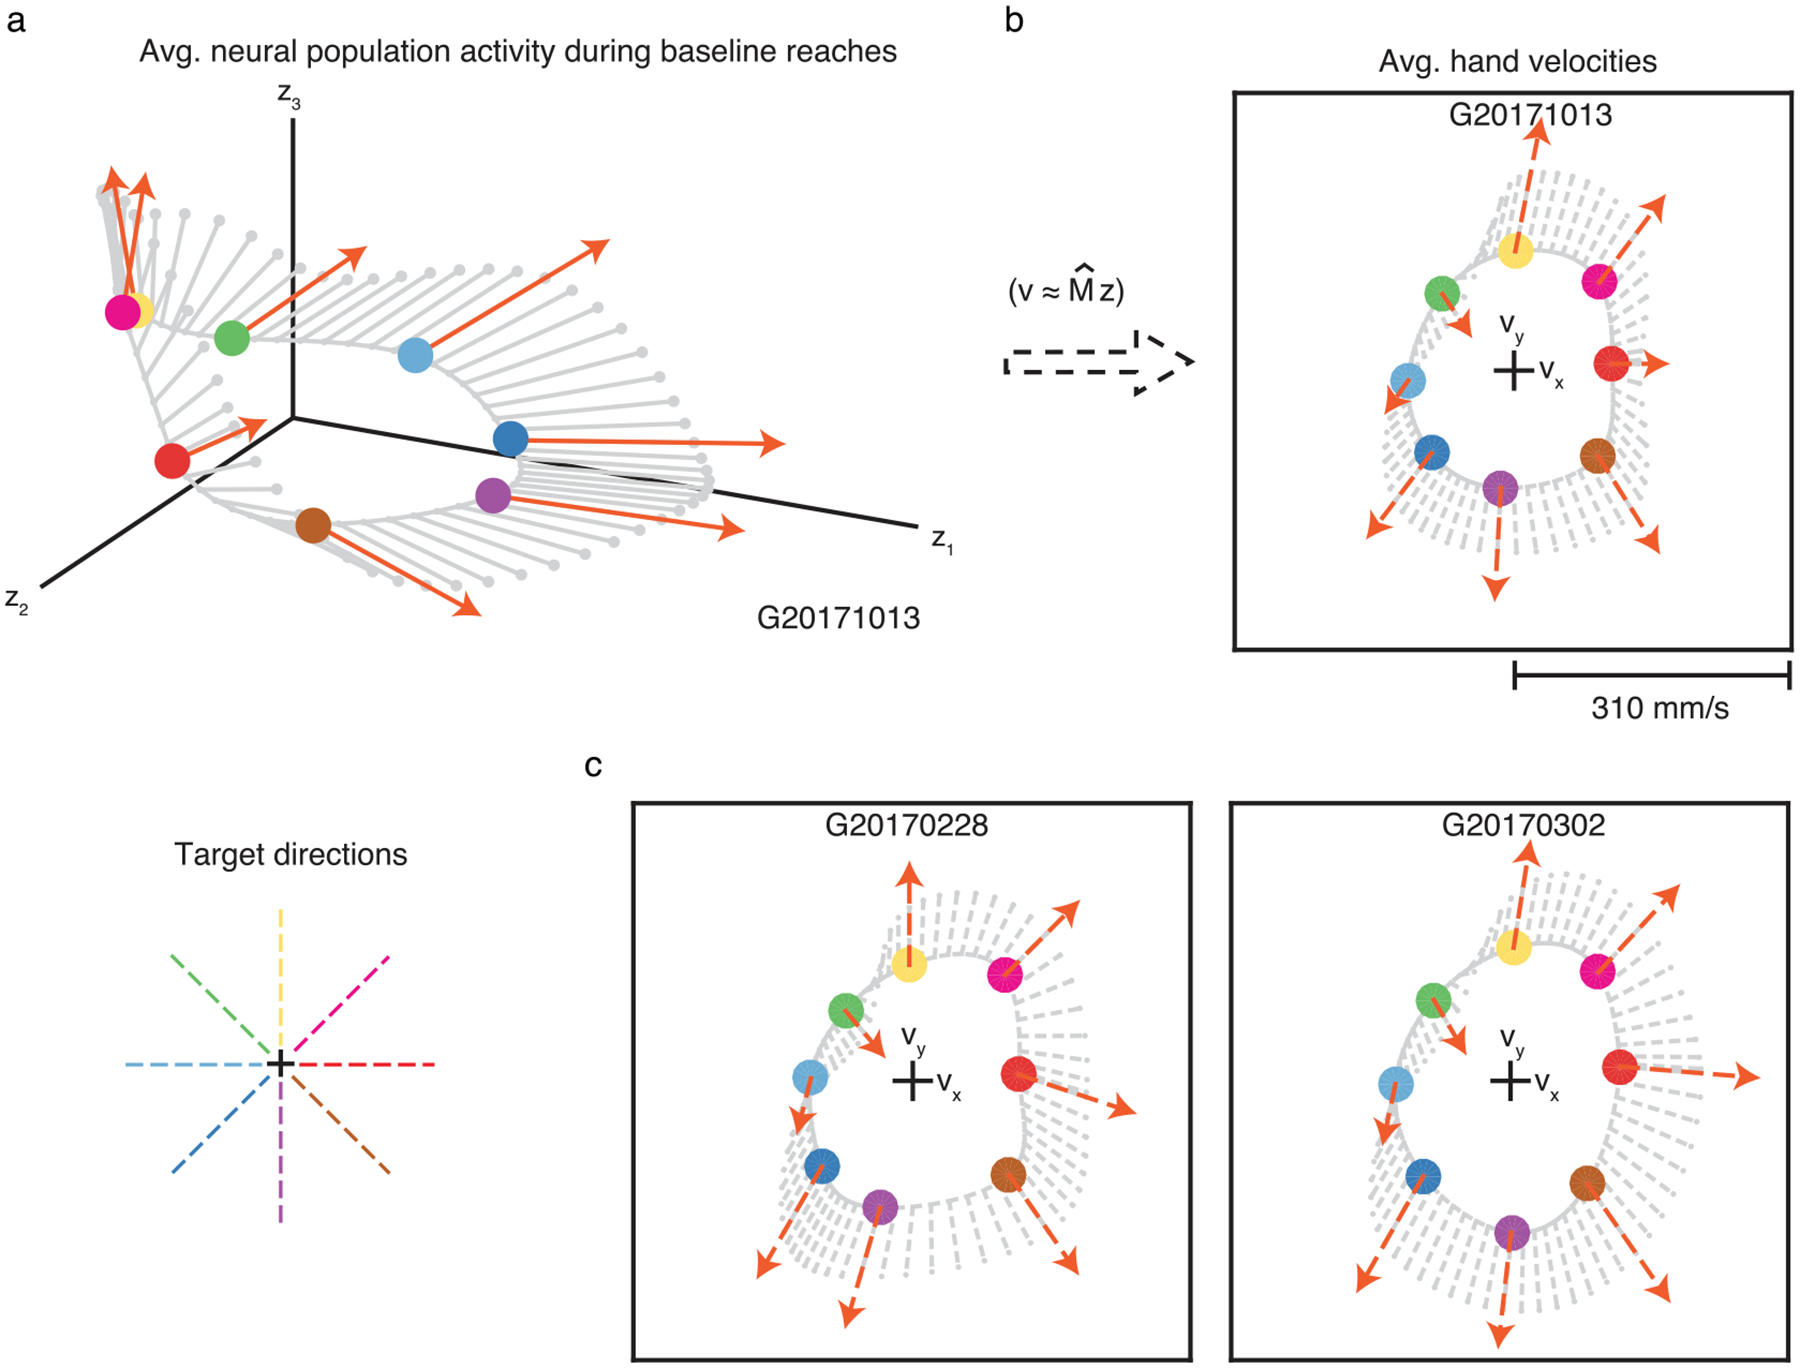
Extended Data Fig. 6 |. Increased neural engagement during arm movements predicted faster hand speeds towards most targets.

a. For the experiments involving arm movements (see Methods), we visualized the average neural population activity (circles) and neural engagement axes (orange arrows) during baseline reaches to each of eight targets. Same conventions as Fig. 3d. ‘Target directions’ panel is a legend depicting the color corresponding to each target direction. b. We also visualized the monkey’s average hand velocity during reaches to each target (circles), similar to Fig. 3e. Unlike during BCI control, we do not know the causal relationship between neural population activity and hand velocity. To understand how changes in neural engagement related to hand velocity, we used linear regression to predict the monkey’s hand velocity during baseline reaches at each 50 ms timestep during the movement epoch of every trial, using the neural population activity recorded 100 ms prior. Cross-validated r2 for the x- and y- components of hand velocity were 67% and 77%, respectively. The linear regression model () allowed us to estimate how increases in the neural engagement related to the monkey’s average hand velocity towards each target (orange dashed arrows), and to intermediate target directions (gray dashed lines). In this session, an increase in neural engagement predicted an increase in the monkey’s hand speed towards all but the 135° target. This suggests that differences in the neural engagement axes across targets may have behavioral relevance. c. We repeated the procedure in panel b during the other two arm movement sessions. Across sessions, increased neural engagement during arm movements predicted faster hand speeds towards most targets.
