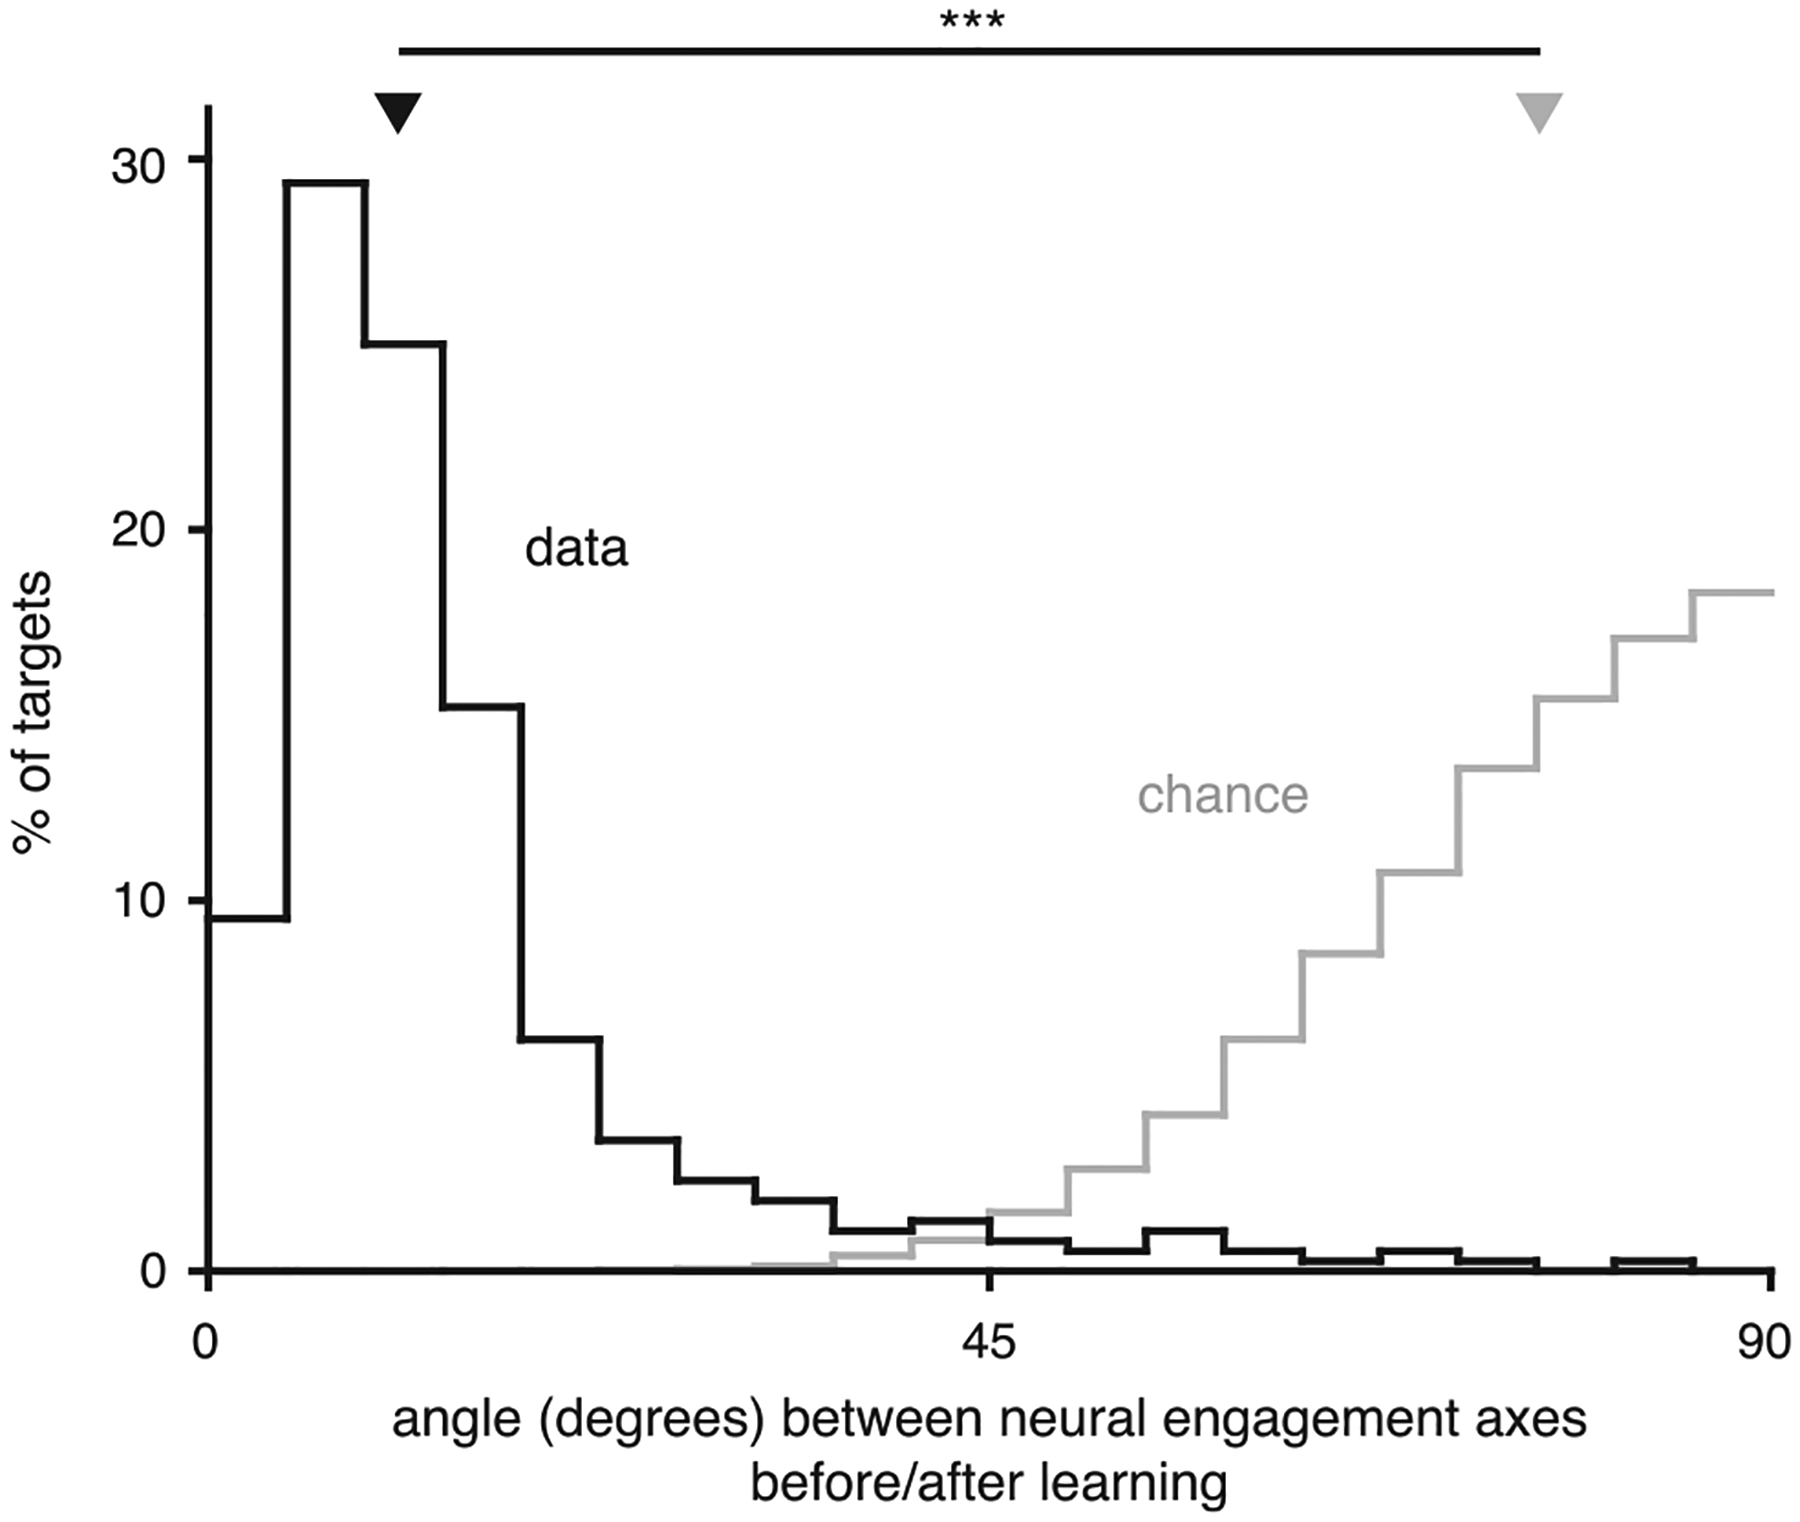
Extended Data Fig. 10 |. Neural engagement axes were largely unchanged after learning.

Distribution of the angle (‘data’, in black) between the neural engagement axis identified for each target during Block 1 (‘before learning’) vs. during the last 50 trials of Block 2 (‘after learning’). To identify neural engagement axes during the last 50 trials of Block 2, we used the same procedure as used during Block 1 (that is, the procedure used in the main text; see Methods), but applied to the last 50 trials of Block 2. ‘Chance’ (in gray) indicates the distribution of the angle between random directions in ten-dimensional space. Triangles depict the medians of the ‘data’ and ‘chance’ distributions, which were significantly different (p < 10−10, two-sided Wilcoxon rank-sum test, n1 = 368 (data) and n2 = 50, 000 (chance) axes).
