
Fig. 3 |. Understanding the impact of neural engagement on behavior during a BCI learning task.
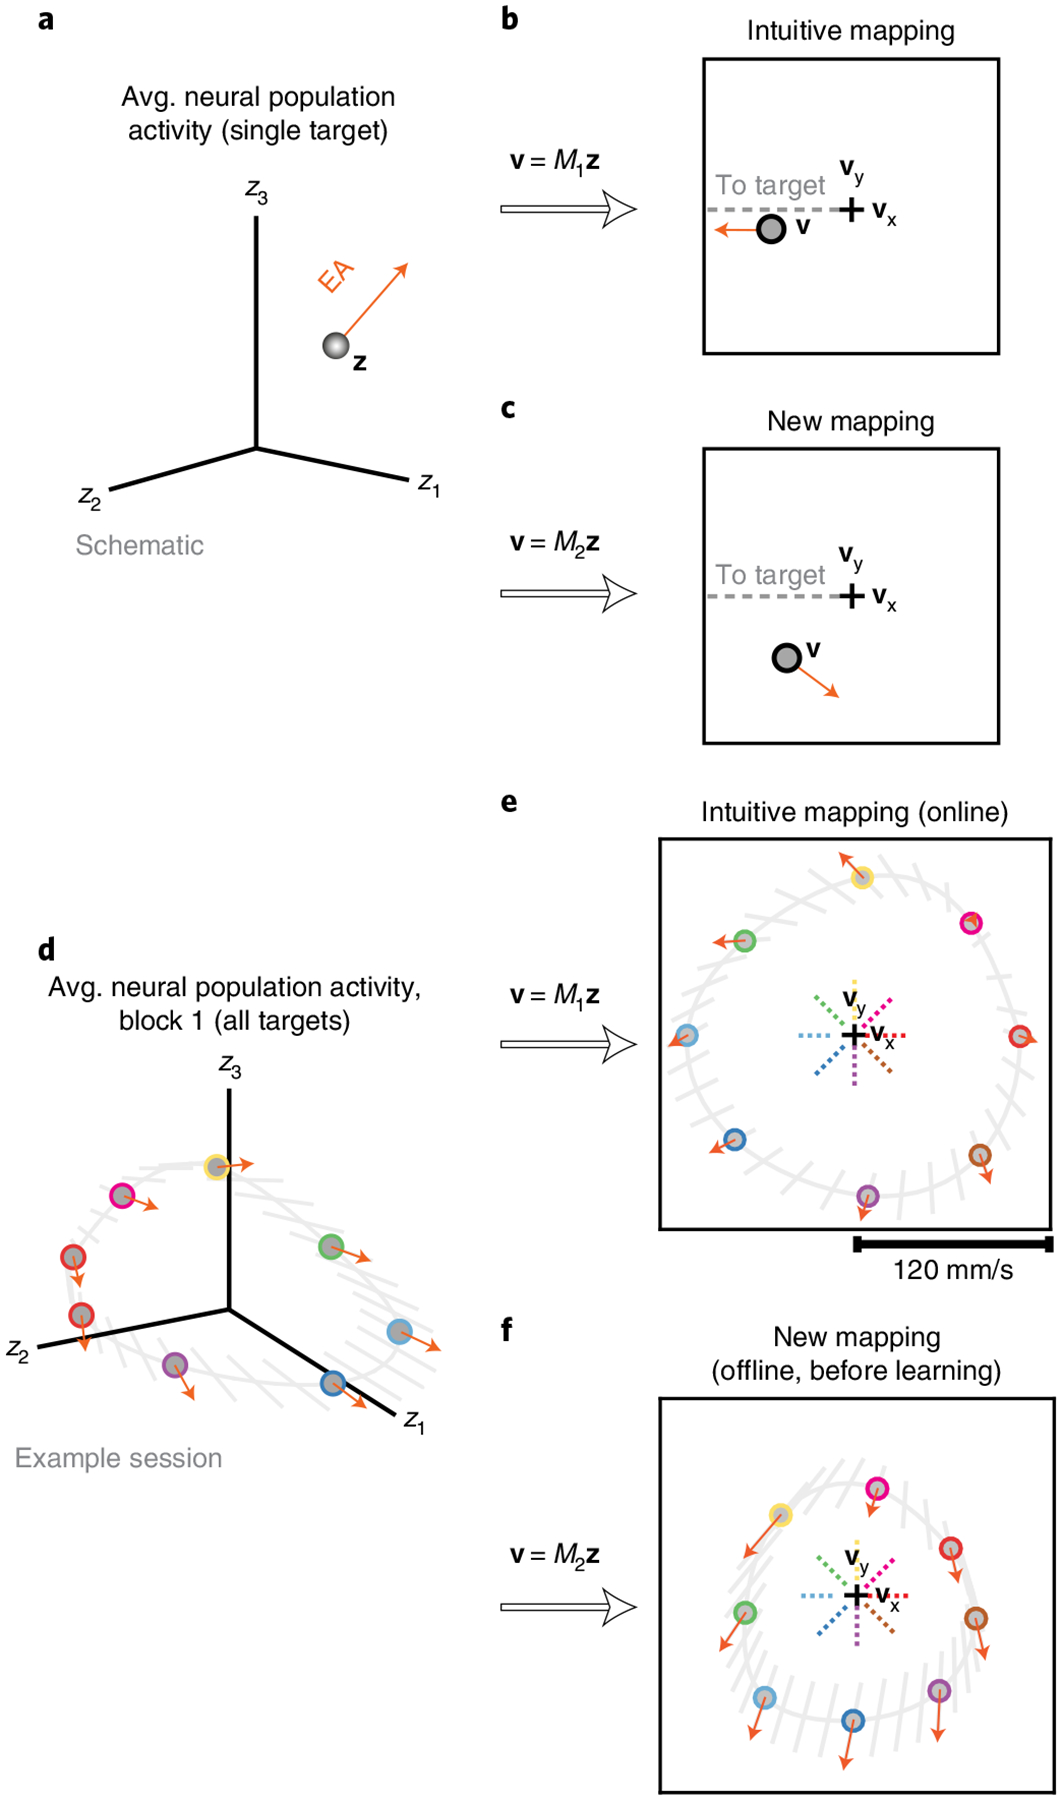
a, Schematic of the average neural activity (z) recorded across all trials to the same target during block 1, along with the direction in which this activity is expected to move following an increase in neural engagement (EA, engagement axis). b, Using the intuitive BCI mapping (M1), we can inspect the intuitive cursor velocity (v, gray circle) corresponding to z, as well as how this velocity will change if neural engagement increases. In this case, increased neural engagement will result in faster cursor movements toward the target (gray dashed line). Zero velocity is indicated by the black cross. c, We can repeat the same procedure using the new BCI mapping (M2) with the same neural activity z and neural engagement axis. d–f, In an example session, the trial-averaged neural activity (gray circles with colored outlines) and engagement axes for all eight targets is visualized. Target directions are indicated with dashed colored lines. Gray lines indicate interpolations between the neural engagement axes for each target. Avg., average.