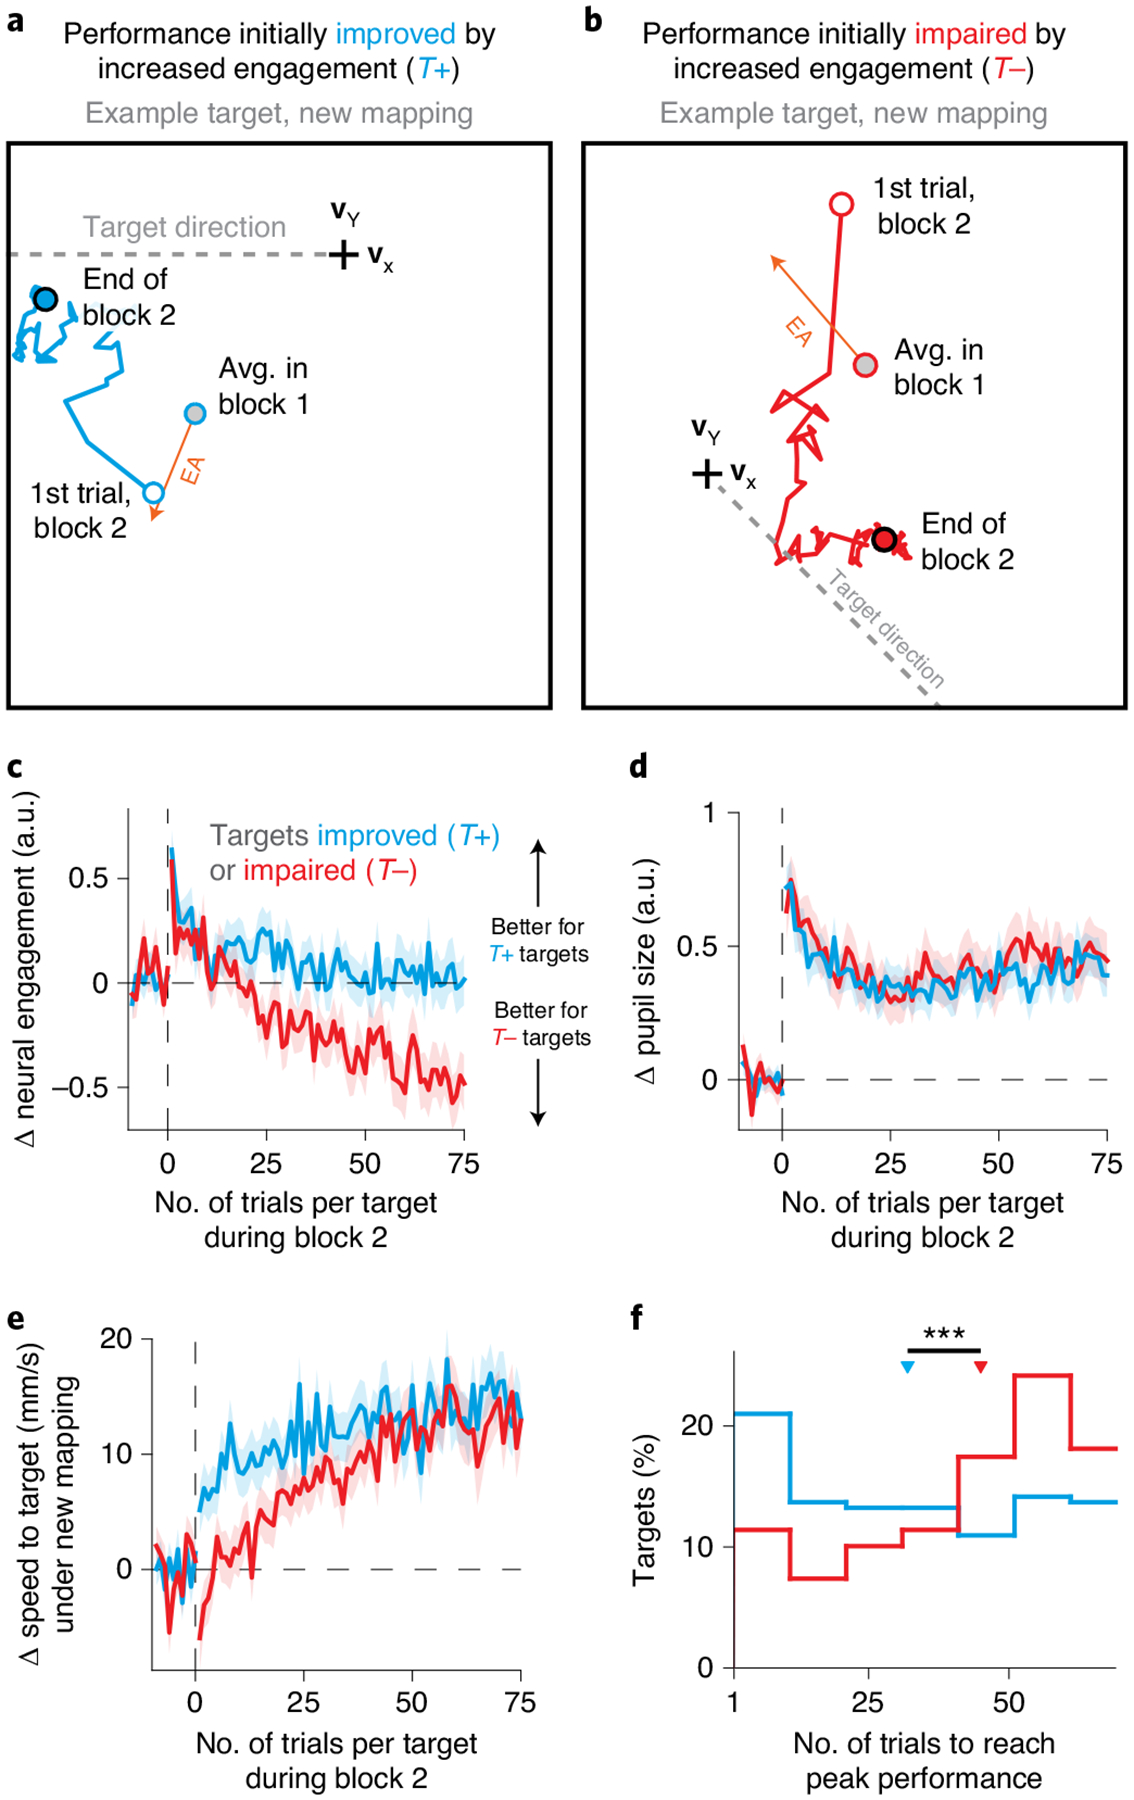
Fig. 5 |. Relationship between neural engagement axes and task performance predicted which targets were learned more quickly.

a, Average cursor velocities under the new mapping across trials during block 2, for an example T+ target (180°; session J20120528) where an increase in neural engagement initially improved performance relative to the average activity produced during block 1 (gray circle). Same conventions as Fig. 4a. The blue line depicts how the trial-averaged velocity evolved throughout block 2, starting with the first trial to that target (white circle) and ending with the average during the last trials (blue circle). Velocities gradually moved toward the target direction, both decreasing angular error and increasing the speed in the target direction, indicating learning. b, Same as a, but for an example T− target (315°; J20120601) where an increase in neural engagement was initially expected to impair performance under the new mapping. c, Changes in neural engagement during block 2, averaged across T+ (n = 220) and T− (n = 148) targets (mean ± s.e.). Trial index is relative to the start of block 2 for each target. d, Changes in pupil size during block 2. Same conventions and sample sizes as in c. e, Changes in cursor speed toward the target under the new mapping during block 2, relative to the expected speed under the new mapping based on the neural activity produced during block 1. Same conventions and sample sizes as in c. f, Distribution of the number of trials at which each target attained its peak level of performance (Methods), for all T+ and T− targets. Triangles depict the median of each distribution; asterisks indicate that the medians were significantly different (p = 1.259 × 10⁻⁴, two-sided Wilcoxon rank-sum test, n1 = 220 and n2 = 148 targets).
