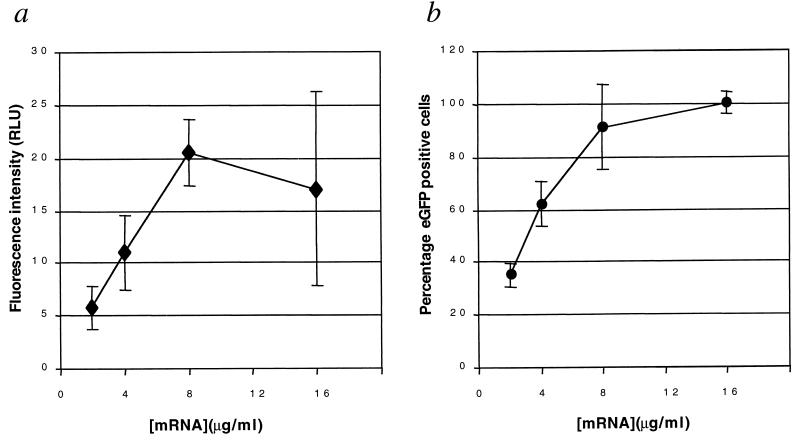
FIG. 2.
Intensity and frequency of eGFP expression following mRNA transfection. (a) Fluorescence intensity of human MDM following transfection with increasing amounts of eGFP mRNA-Oligofectin G complex. The fluorescence intensity is represented as relative light units (RLU), with the average background of the image subtracted. (b) Frequency of eGFP-positive cells as a function of increasing concentration of transfection complex. Each point represents the percentage of cells in three fields which are more than two standard deviations above the RNA control for that concentration.

