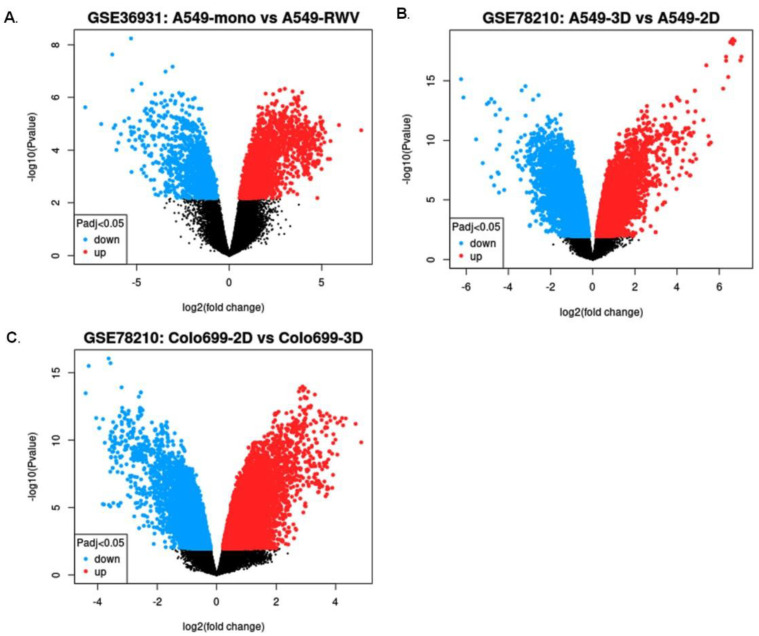
Figure 1.
Volcano plot showing differentially expressed genes (DEGs) using GEO Omnibus. (A) Volcano plot showing DEGs under SMG and GG effects in A549 cells using (A) GSE78210 and (B) GSE36931 datasets. (C) Volcano plot showing DEGs under SMG and GG effects in Colo699 cell line using GSE78210 dataset. Red color indicates upregulated genes, while blue color indicates downregulated genes.

