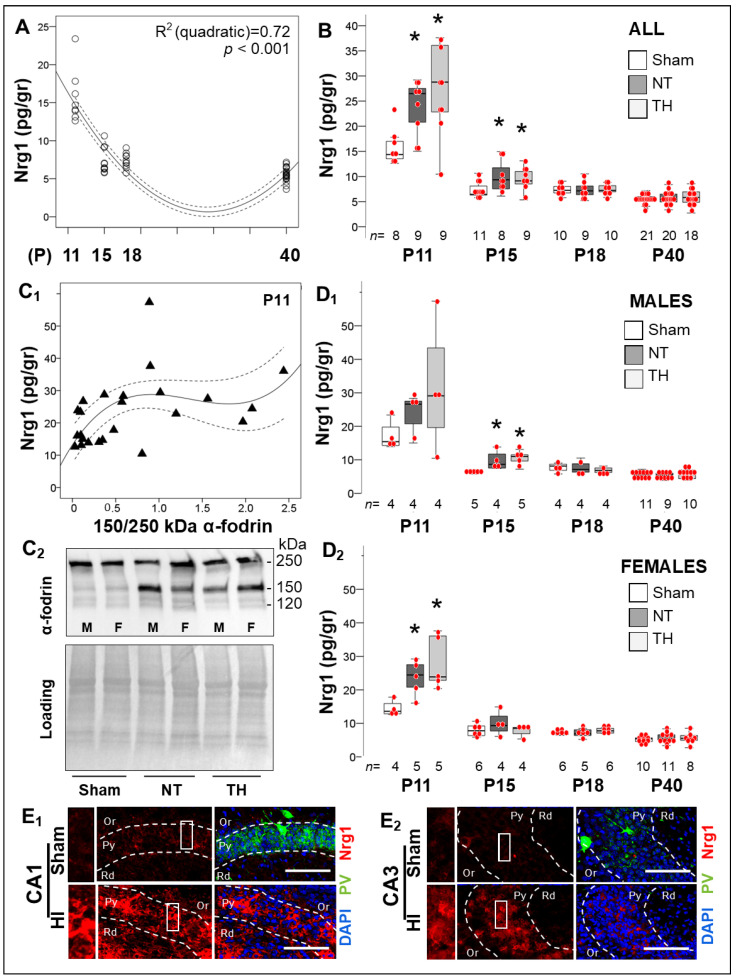
Figure 5.
Long-term changes in Nrg1 levels in the hippocampus in response to neonatal HI. (A) Hippocampal Nrg1 levels decreased between P11 and P18 and reach a nadir prior to P40 (quadratic R2 0.72, p < 0.001). (B) HI increased hippocampal Nrg1 levels by 84.4% (p = 0.01) and 44.8% (p = 0.05) at P11 and P15 after the insult, respectively (KW p < 0.05; *, Dunn-Bonferroni post-hoc p < 0.05 vs. sham). After 120h, Nrg1 was similar in all three groups. (C) The 150 kDa α- fodrin breakdown product weakly correlated with Nrg1 (Spearman’s Rho r = 0.53, p = 0.004) in a cubic regression, which plateaued at a Nrg1 level of ~28.5 pg/gr of protein (C1). Representative western blots demonstrating the breakdown of α- fodrin are shown at 120 and 150 kDa (C2). (D) Stratification by sex, demonstrated that Nrg1 peaked early after neonatal HI in both male and female mice (KW p = 0.02 and KW p = 0.01, respectively), but sooner in female mice. (E) Higher Nrg1 (red) and lower PV (green) expression are shown in CA1 (E1) and CA3 (E2) pyramidal cell layer (Py) in the dorsal hippocampus of HI-injured mice compared to sham by IF-IHC and confocal microscopy. Scale bar = 200 µm. Quantifications are shown as hybrid box & whisker and vertical dot plots. *, p < 0.05 (Dunn-Bonferroni post-hoc test for Kruskal Wallis ANOVA; n shown under each box).

