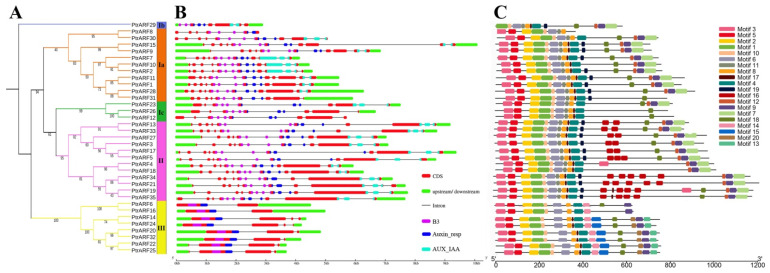
Figure 4.
Phylogenetic tree, gene structures, and protein motifs of 35 PtrARF genes. (A) The phylogenetic tree. PtrARF protein sequences were aligned with Clustal X 2.0, and the phylogenetic tree was constructed using the neighbor-joining method; (B) Gene structures. Red boxes represent CDS regions, green boxes represent 5′UTR or 3′UTR regions, and black lines represent introns regions. The BD domains are indicated by purple boxes, the Auxin_resp domains are indicated by blue boxes, and the AUX_IAA domains are indicated by cyan boxes. The sizes of the exons and introns are estimated using the scale at the bottom; (C) protein motifs. The motif logos were drawn using Tbtools. Conserved motifs (1–20) are represented by different colored boxes, while non-conserved sequences are shown by black lines.

