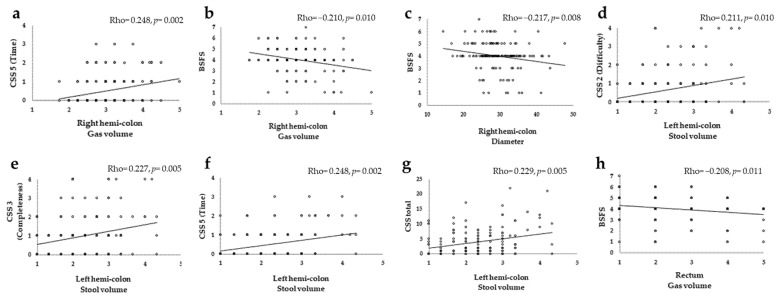
Figure 3.
Scatter plot and the Spearman’s correlation coefficients of CT images and constipation symptoms. (a): Right hemi-colon gas volume and CSS5 (Time). (b): Right hemi-colon gas volume and BSFS. (c): Right hemi-colon diameter and BSFS. (d): Left hemi-colon stool volume and CSS2 (Difficulty). (e): Left hemi-colon stool volume and CSS3 (Completeness). (f): Left hemi-colon stool volume and CSS5 (Time). (g): Left hemi-colon stool volume and CSS total. (h): Rectum gas volume and BSFS. Correlation coefficient Rho (p-value): Rho < −0.20 or Rho > 0.20 with p < 0.05 indicates a significant difference. CSS, Constipation Scoring System; BSFS, Bristol Stool Form Scale.

