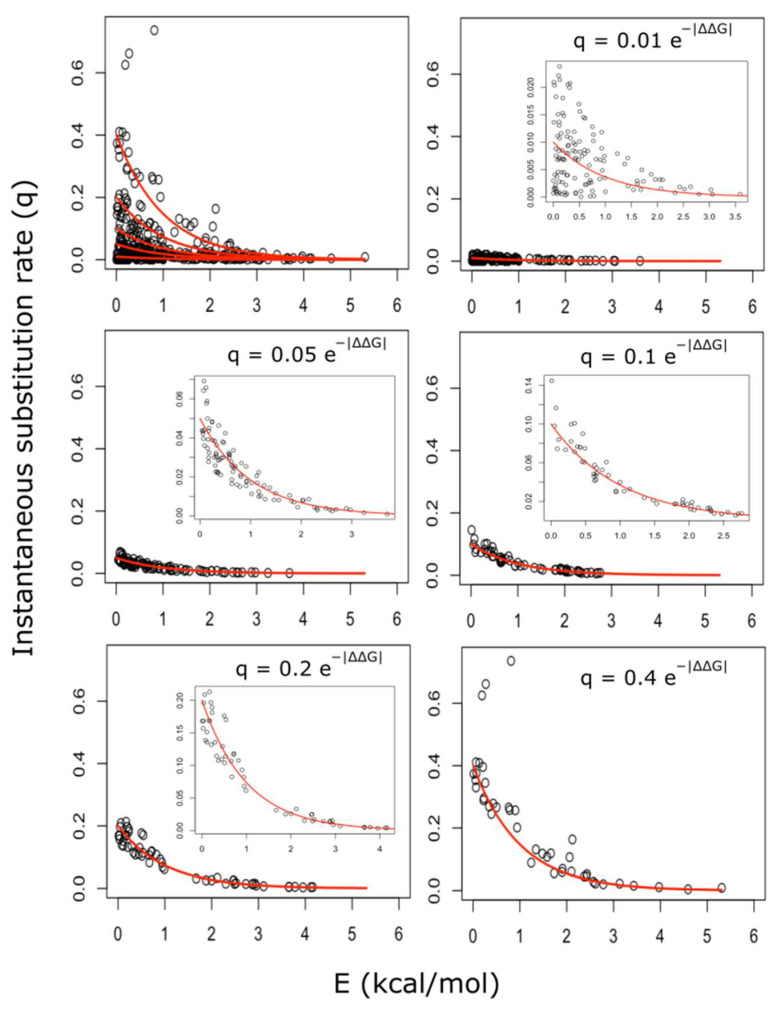
Figure 3.
Arrhenius kinetic models accounted for the empirical instantaneous amino acid substitution rates. The top left panel shows a scatter plot q against E, where the five negative exponential curves used to partition the points are drawn in red. The remaining five panels show the indicated group resulting from the partition. The insets display the same plots, but with rescaled axes.

