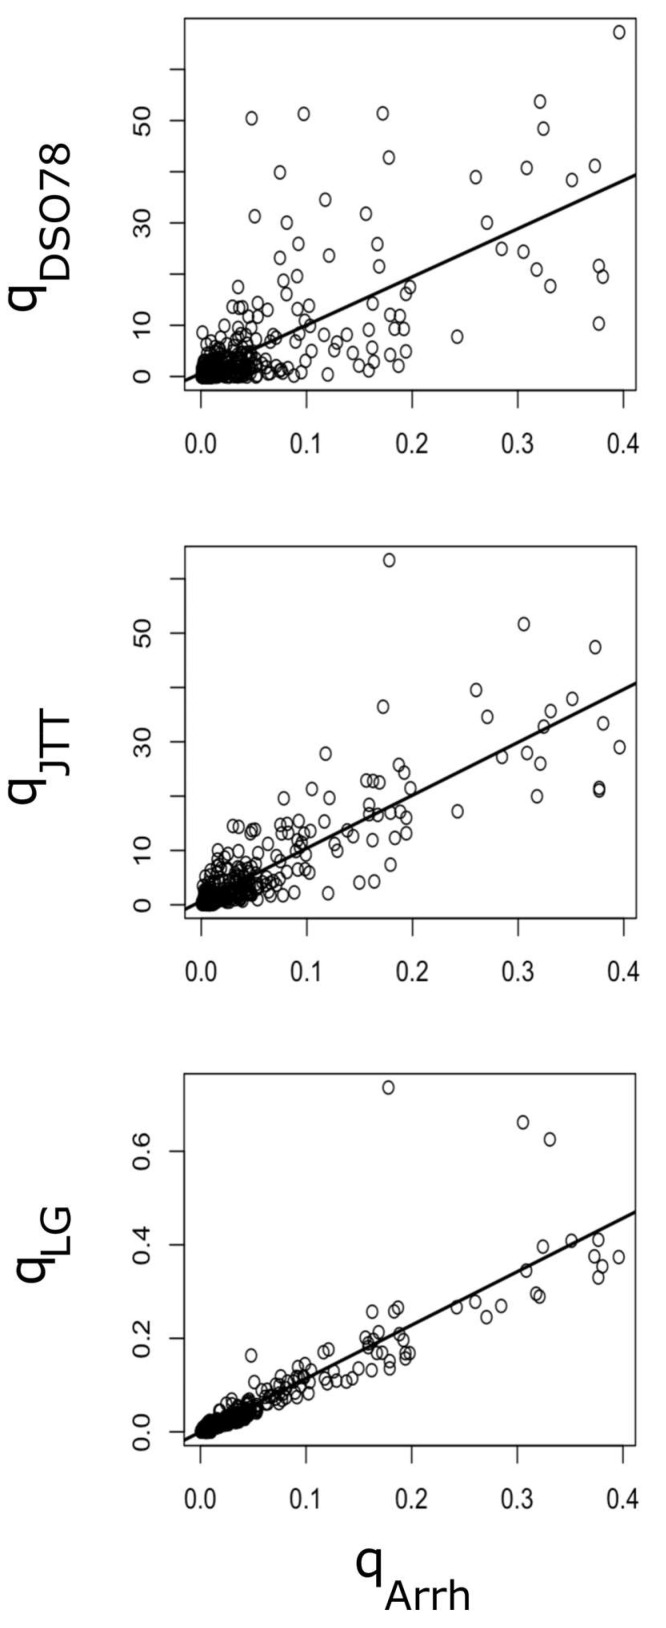
Figure 4.
Relationship between empirical amino acid substitution matrices and the Arrhenius kinetic model. The instantaneous substitution rate values, corresponding to the QDSO78, QJTT and QLG matrices, have been plotted against the matrix computed according to the Arrhenius model. The correlation coefficients are given in Table 2, and the p-values were less than 2.2 × 10⁻¹⁶ in the three cases. The R2 values were 0.510, 0.730 and 0.823, respectively.

