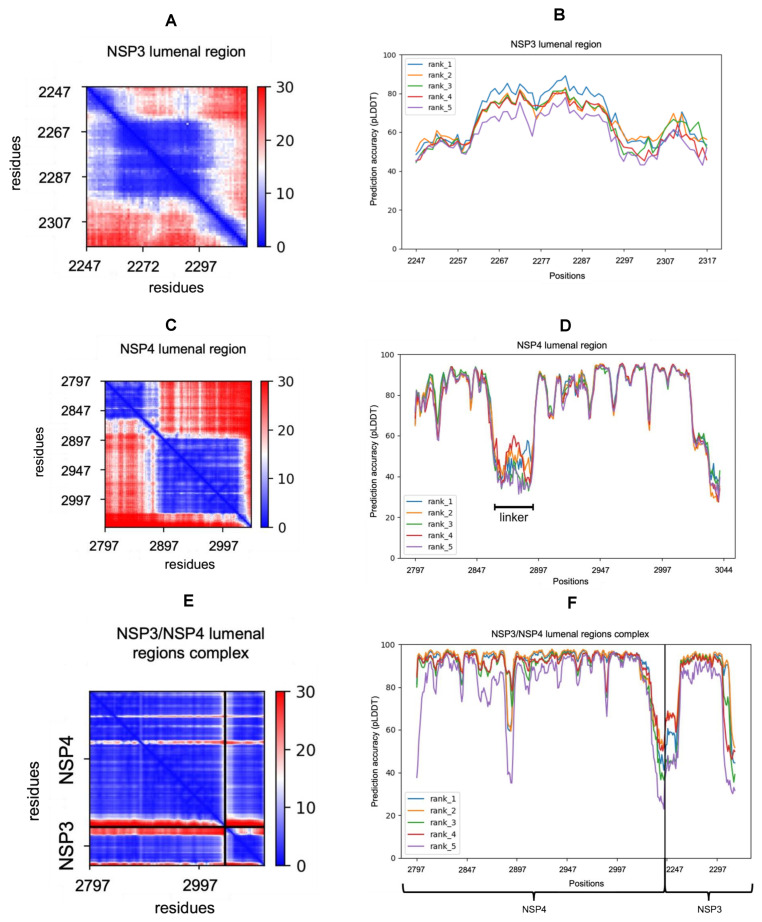
Figure 2.
Quality assessment plots of the lumenal regions predicted alone and in complex. Blue positions in the PAE plots indicate low PAEs, red ones indicate high PAEs (measured in Angstroms). (A) PAE plot of the highest-ranked model of the nsp3 lumenal region. (B) Prediction accuracy pLDDT) plot of the five nsp3 lumenal region models (ranks 1–5). (C) PAE plot of the highest-ranked model of the nsp4 lumenal region. (D) Prediction accuracy plot of the five nsp4 lumenal region models. (E) PAE plot of the highest-ranked model of the nsp3 and nsp4 lumenal regions in complex. (F) Prediction accuracy plot of the five models of the lumenal regions of nsp3 and nsp4 in complex.

