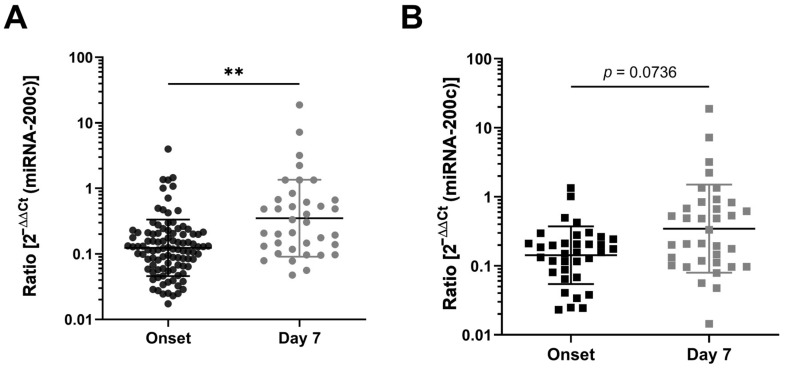
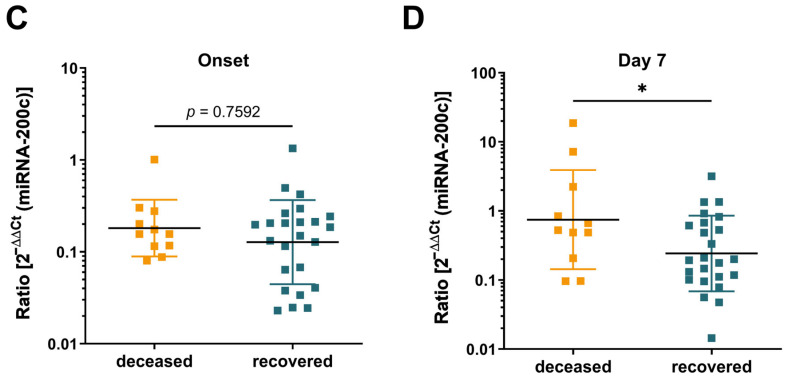
Figure 2.
miRNA-200c expression levels in critically ill COVID-19 patients. (A) Quantitative RT-PCR analysis of miRNA-200c expression of all patients at the time of hospitalization (onset) and at day seven after hospitalization. (B) miRNA expression of patients with study enrollment at both time points (paired sample group; n = 35). (C) Expression levels of miRNA-200c at study enrollment (onset) of the paired sample group according to the clinical outcome of disease. (D) Expression of miRNA-200c in paired sample group at day 7 according to the clinical outcome of disease. The miRNA-200c levels were measured in triplicate. Each dot represents the median value from three measurements. The ratio represents the miRNA-200c values normalized to a healthy control group and the housekeeping gene miRNA-16. The mean values of relative quantification (ratio) of plasma miRNA-200c levels are indicated by horizontal lines. Error bars indicate the standard deviation of the mean. p-values were determined by an unpaired t-test. * p < 0.05, ** p < 0.01.


