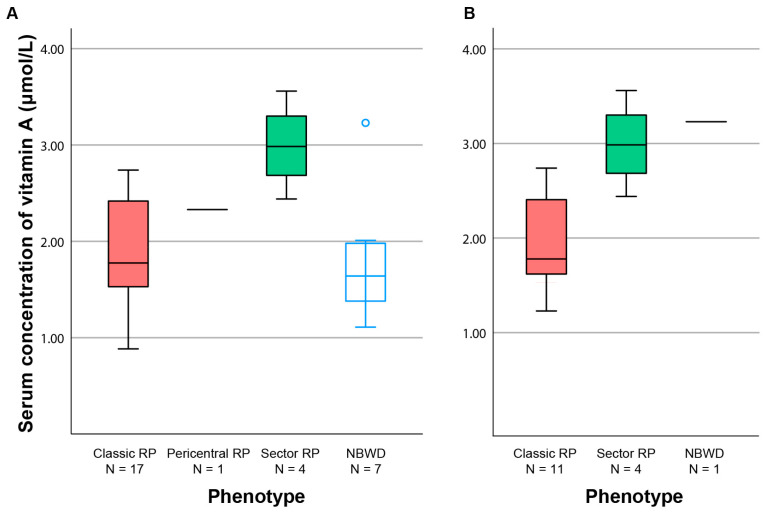
Figure 3.
Boxplot chart showing the serum vitamin A concentration according to the phenotype. Boxes include half of the data and whiskers show the remaining data. The horizontal line indicates the median value (or the value of one patient with pericentral RP). (A) The whole cohort. (B) Patients aged ≥40 years. Note only one remaining patient with NBWD. RP—retinitis pigmentosa; NBWD—night blindness without degeneration.

