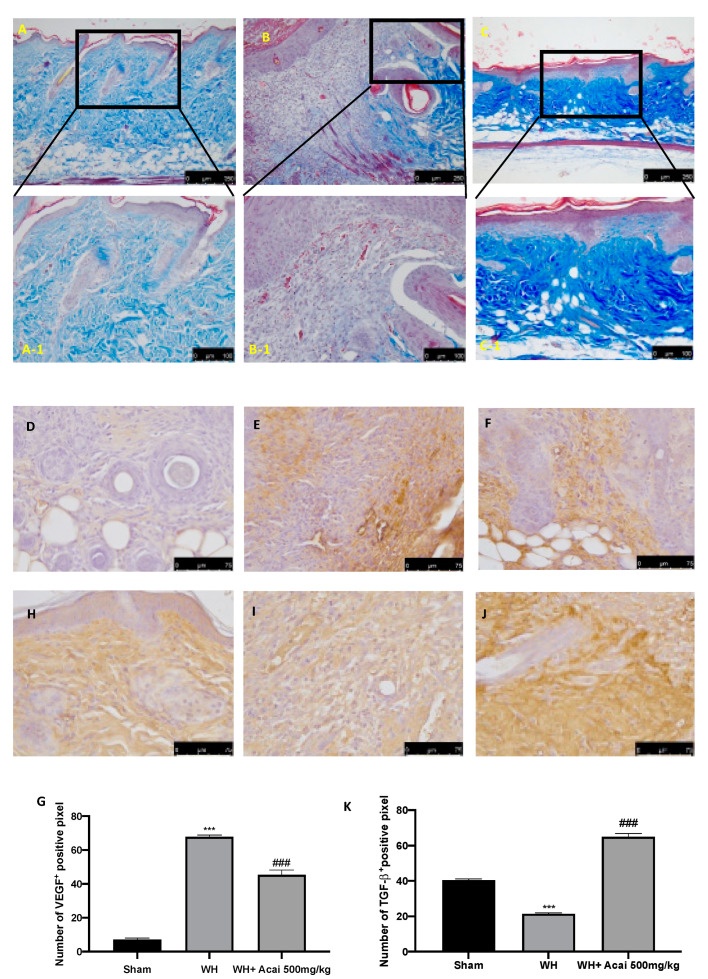
Figure 3.
Masson’s trichrome staining to observe changes in dermal collagen through optical microscopy; sham (A,A-1), WH (B,B-1), WH + açai berry (C,C-1). A 10× and 20× magnification is shown. Immunohistochemical analysis of VEGF (G) and TGF-β (K); sham (D,H), WH (E,I), WH + açai berry (F,J). A 75× magnification is shown. A demonstrative blot of lysates with a densitometric analysis for all animals is shown. Data are expressed as the mean ± SEM of N = 6 mice/group. *** p < 0.001 vs. sham; ### p < 0.001 vs. WH.

