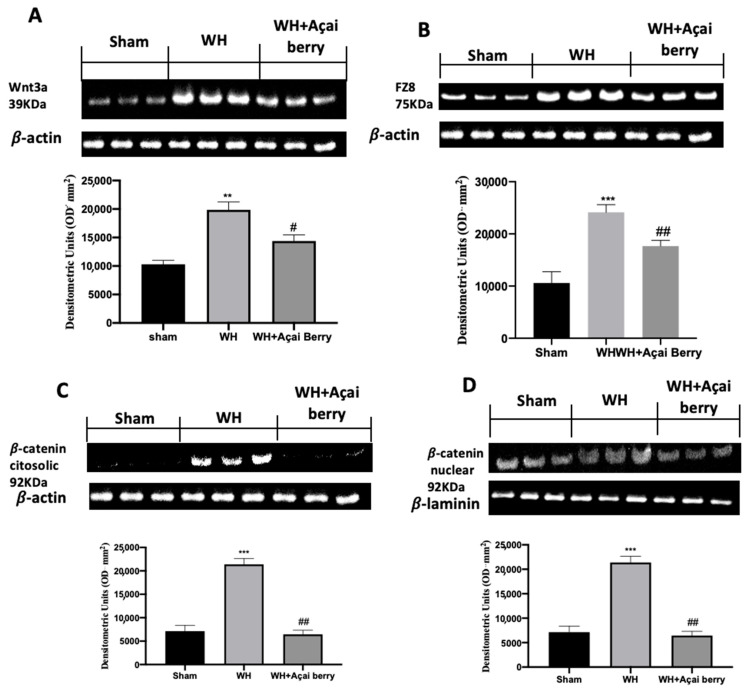
Figure 7.
Western blot analysis of Wnt3a (A), FZ8 (B), cytosolic β-catenin (C), and nuclear β-catenin (D). A demonstrative blot of lysates with a densitometric analysis for all animals is shown. Data are expressed as the mean ± SEM of N = 6 mice/group. ** p < 0.01 vs. sham, *** p < 0.001 vs. sham; # p < 0.05 vs. WH; ## p < 0.01 vs. WH.

