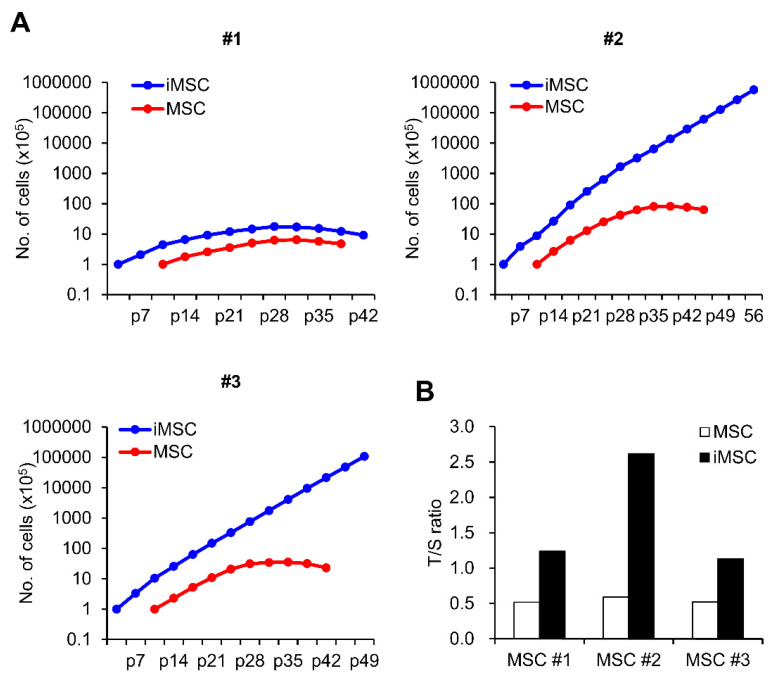
Figure 2.
Comparison of proliferation potential between iMSCs and donor-matched primary MSCs. (A) Cumulative cell number assay of 3 lines of iMSC and donor-matched primary MSCs. Numbers represent individual donor cell origin. p = passage number. (B) Relative telomere length of individual iMSCs in comparison to donor-matched MSCs expressed as a T/S ratio (telomere/single copy) measured by real time PCR.

