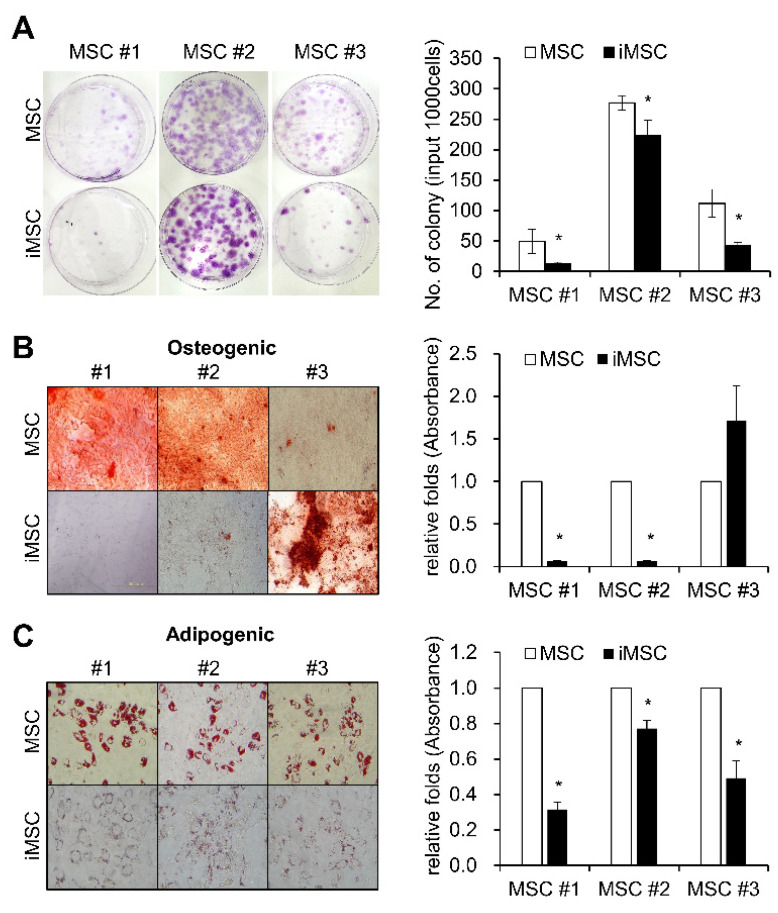
Figure 3.
Colonogenic and differentiation potential of iMSCs in comparison with donor-matched MSCs. (A) Each individual iMSC line and their parental donor-matched MSCs were subjected to colony formation (CFU-F) assays and stained with crystal violet. Representative images for CFU-F assays (left panel) and their quantification (right) are shown (n = 3, mean ± SEM, *; p < 0.05). (B) Osteogenic differentiation of MSCs and iMSCs analyzed by Alizarin Red S staining for calcium deposition. Representative images for osteogenic differentiation (left) and quantification as determined by the absorbance at 405nm (right) are shown (n = 3, mean ± SEM, *; p < 0.05). (C) Adipogenic differentiation of MSCs and iMSCs analyzed by Oil- Red O staining for lipid droplets. Representative images for adipogenic differentiation (left) and the quantification by absorbance at 520nm (right) (n = 3, mean ± SEM, *; p < 0.05) are shown.

