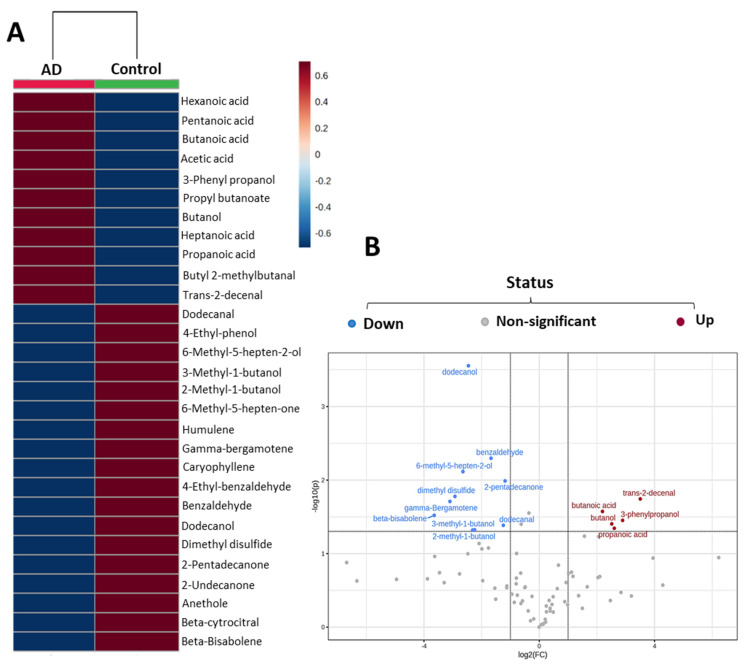
Figure 4.
Most relevant fecal volatile organic compounds (VOCs) in the control subjects and the Alzheimer’s disease (AD) patients. (A) Heatmap plot of the 29 most relevant VOCs selected by the VIP scores. (B) Volcano plot developed with the relative peak area of the total VOCs identified. The more significant VOCs are colored in blue (down) and in red (up); (n = 10, control subjects; n = 12, AD patients; 4 per stage).

