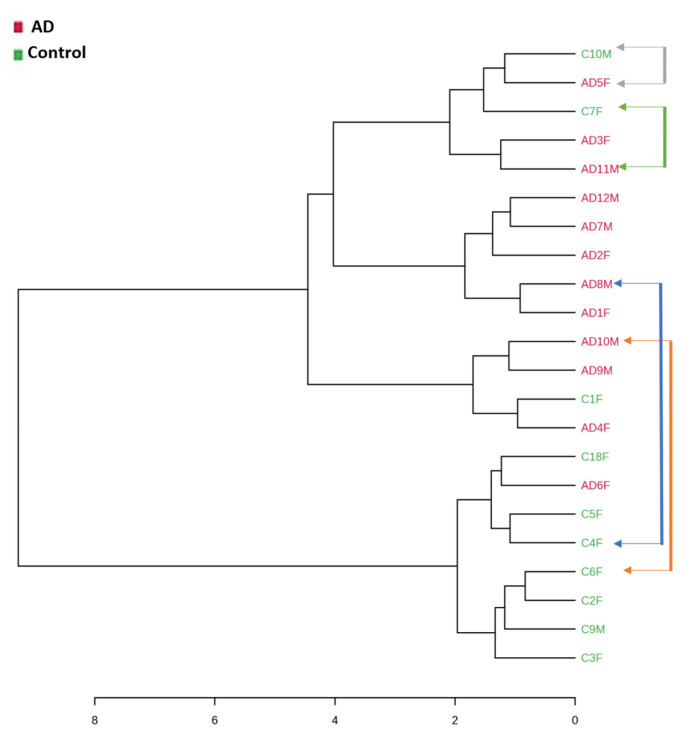
Figure 6.
Dendrogram with a Spearman distance measure and a Ward clustering algorithm obtained from the total of VOCs identified in the feces from the control subjects and the Alzheimer’s disease (AD) patients. The pairs of the samples highlighted with an arrow correspond to the married couples; (n = 10, control subjects; n = 12, AD patients).

