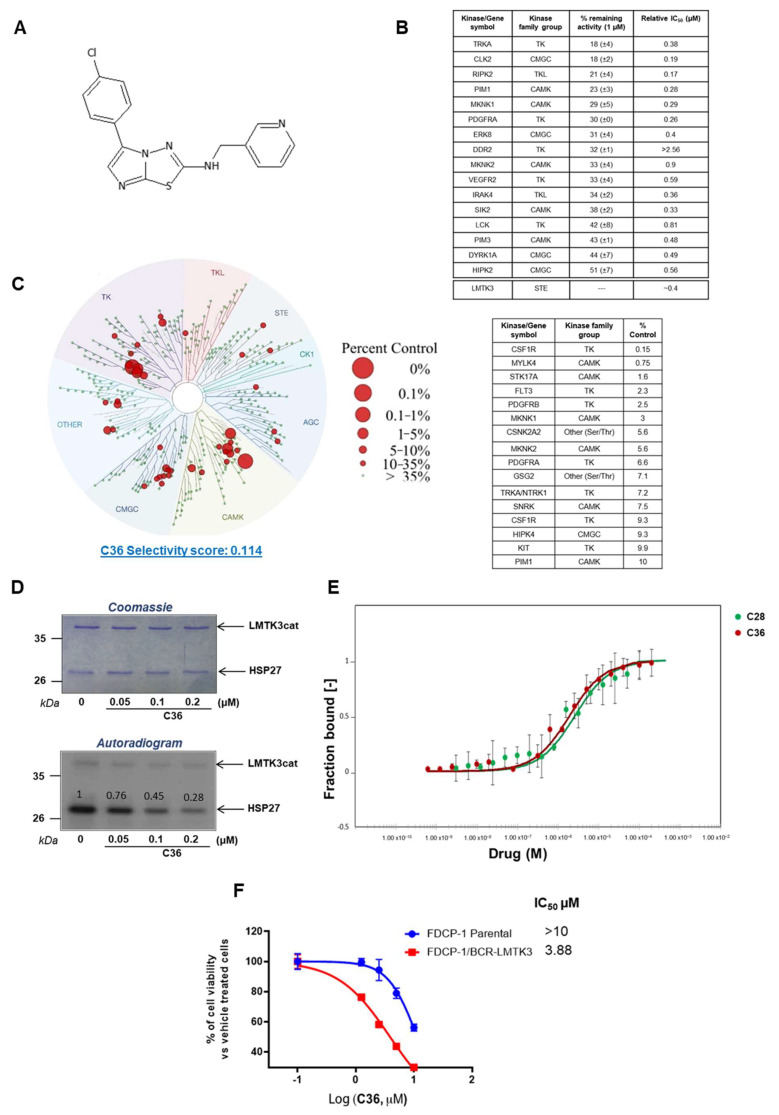
Figure 1.
Selectivity of C36 toward LMTK3. (A) Chemical structure of C36. (B) Selectivity profile of C36 (1 µM) against 140 kinases using radioactive filter binding assay (MRC International Centre for Kinase Profiling unit). The data are displayed as the percentage of activity remaining of assay duplicates with a SD. Only kinases with >50% decrease in their activity are shown. The relative IC50 values are also presented. (C) TREEspot interaction map depicting the kinome phylogenetic grouping, with kinases interacting with C36 (5 µM) represented as red circles (DiscoverX KINOMEscan [25]). Kinases whose binding affinity was inhibited by C36 to less than 10% of the control (DMSO) are shown in the table. Lower numbers indicate the most probable hits to bind to C36. The larger the diameter of the circle, the higher the C36 binding affinity to the respective kinase active site. (D) The IC50 value for C36 against LMTK3cat (LMTK3 kinase domain) was determined by in vitro kinase assay. The intensities of the bands on the autoradiogram have been quantified using ImageJ software and normalized to total protein levels based on Coomassie Blue stained membranes. DMSO has been used as a control (E) MST binding curves for C36 (Kd = 1.87 ± 0.2 µM, red curve) and C28 (Kd = 2.50 ± 0.4 µM, green curve) with LMTK3, showing fraction bound on the Y axis and drug concentration (M) on the X axis. More specifically, fraction bound is calculated as the ratio between the emitted fluorescence of LMTK3-C36/C28 complex and the curve amplitude [26]. The error bars represent the SD of each data point calculated from three independent experiments. Binding check analysis reveals no interaction between DMSO (control) and LMTK3 kinase domain (signal to noise ratio: 1.2) (Figure S2). (F) IC50 values for C36 in FDCP1 and FDCP1-LMTK3 cell lines. Error bars represent the means ± SD from three independent experiments.

