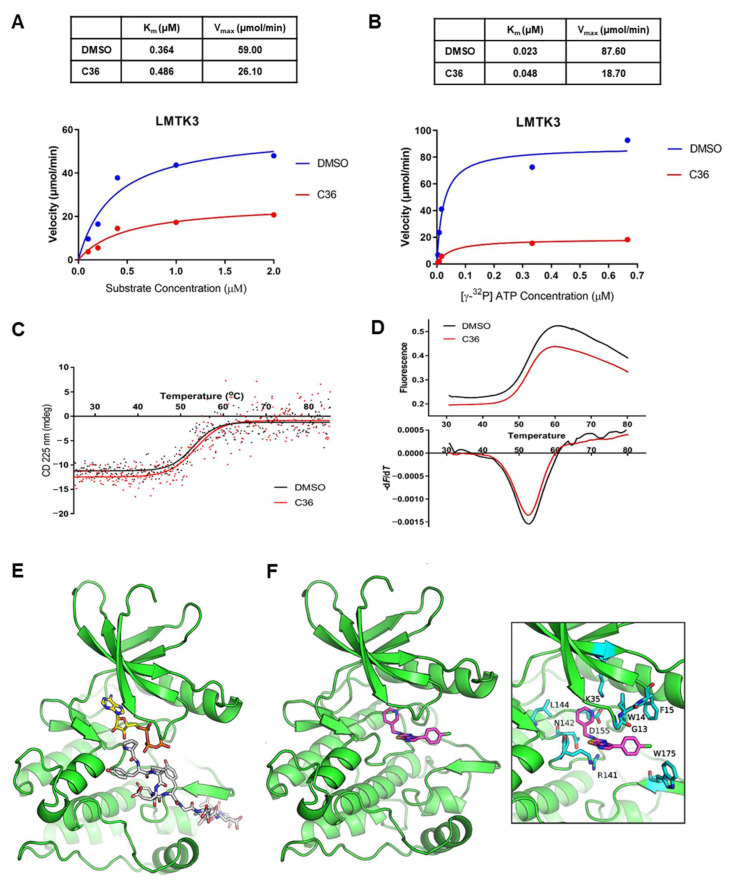
Figure 2.
Identification of C36 as a potent inhibitor against LMTK3. (A) Kinetic analysis of C36 inhibition with respect to HSP27 concentration (fixed ATP concentration). Kinetic parameters (Km and Vmax) were determined from nonlinear regression fit of the initial reaction rates as a function of HSP27 concentration to the Michaelis–Menten equation using GraphPad Prism 8.01 software (GraphPad Software, Inc., San Diego, CA, USA). (B) Kinetic analysis of C36 inhibition as a function of ATP concentration (fixed HSP27 concentration of 0.6 μM). Kinetic parameters (Km and Vmax) were determined from nonlinear regression fit of the initial reaction rates as a function of ATP concentration to the Michaelis–Menten equation using GraphPad Prism 8.01 software. (C) Characteristic melting plots obtained from CD spectroscopy for LMTK3 in the absence (DMSO) and presence of inhibitor (C36). (D) Characteristic melting curves obtained from thermal shift assay measurements. (E) Molecular model of LMTK3 in the active state with bound ATP and a peptide fragment of insulin receptor substrate 2 (IRS2). The kinase domain of LMTK3 is shown with green color, the bound ATP is color-coded with yellow C atoms, and the substrate with grey C atoms; blue is for N, red is for O, yellow is for S, and orange is for P. (F) Docked pose of C36 in the active state of ligand-free LMTK3. Inset is a close-up view illustrating residue-specific interactions. C36 is shown with purple C atoms and LMTK3 residues with cyan C atoms.

