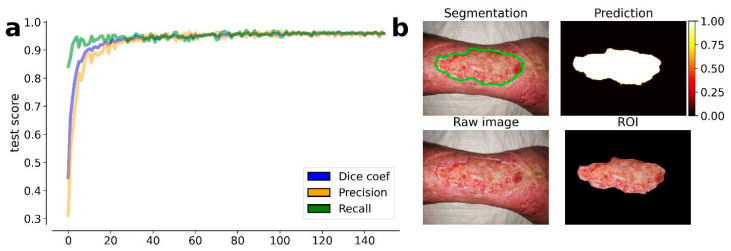
Figure 1.
Results obtained by the trained U-Net model at the 4th round of training. (a) Evolution of the average metrics (dice coefficient, precision, and recall) during the training epochs (150). The metric values are estimated on the test set, i.e., the 10% of available images, which were excluded from the training set. On the top left image is the resulting segmentation. (b) On the top right image is the predicted segmentation mask. On the bottom left image is the raw (input) image. On the bottom right image is the resulting ROI of the wound area.

