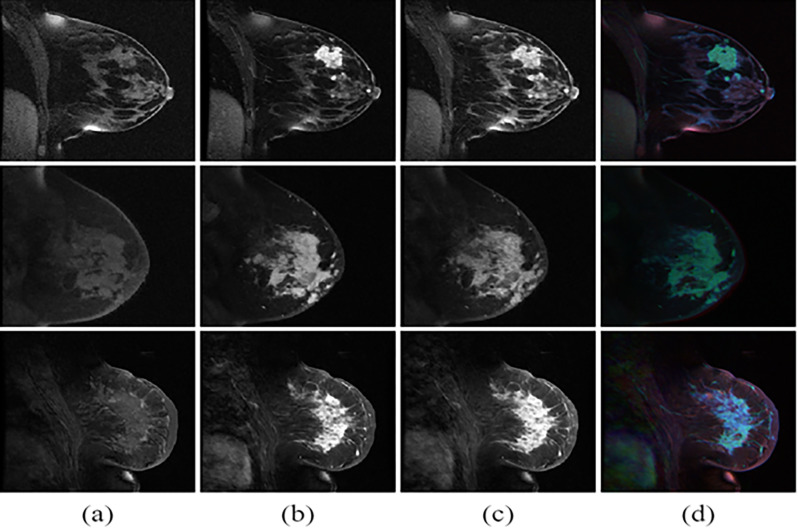
Fig 2. Three phase DCE MR images from three typical patients.
(a) phase I, b) phase II, and c) phase III, and (d) the composite image from DCE dynamics displayed as color. Regions in which the first dynamic are brighter appear redder, regions in which the second dynamic are brighter appear greener, and regions in which the third dynamic are brighter appear bluer.

